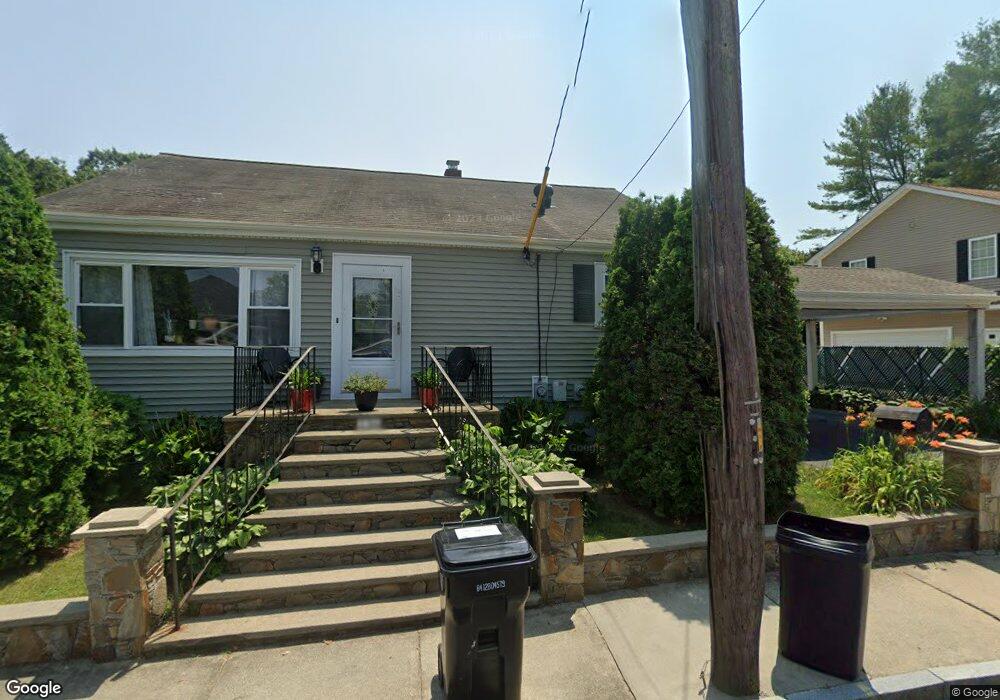
136 Sharp St North Dartmouth, MA 02747
Bliss Corner NeighborhoodEstimated Value: $445,302 - $471,000
3
Beds
1
Bath
1,080
Sq Ft
$423/Sq Ft
Est. Value
About This Home
This home is located at 136 Sharp St, North Dartmouth, MA 02747 and is currently estimated at $457,326, approximately $423 per square foot. 136 Sharp St is a home located in Bristol County with nearby schools including Dartmouth High School, St. Teresa of Calcutta School, and Our Sister's School.
Ownership History
Date
Name
Owned For
Owner Type
Purchase Details
Closed on
Jun 16, 1992
Sold by
Langlois Paul W
Bought by
Medeiros Nelson A and Medeiros Elizabeth
Current Estimated Value
Home Financials for this Owner
Home Financials are based on the most recent Mortgage that was taken out on this home.
Original Mortgage
$100,100
Interest Rate
8.79%
Mortgage Type
Purchase Money Mortgage
Purchase Details
Closed on
Jan 31, 1992
Sold by
Madeira Joao C and Madeira Ana I
Bought by
Langlois Paul W
Purchase Details
Closed on
Dec 24, 1987
Sold by
Harding Rose Marie
Bought by
Madeira Joao C
Create a Home Valuation Report for This Property
The Home Valuation Report is an in-depth analysis detailing your home's value as well as a comparison with similar homes in the area
Home Values in the Area
Average Home Value in this Area
Purchase History
| Date | Buyer | Sale Price | Title Company |
|---|---|---|---|
| Medeiros Nelson A | $99,900 | -- | |
| Langlois Paul W | $80,400 | -- | |
| Madeira Joao C | $96,000 | -- |
Source: Public Records
Mortgage History
| Date | Status | Borrower | Loan Amount |
|---|---|---|---|
| Open | Madeira Joao C | $114,182 | |
| Closed | Madeira Joao C | $96,300 | |
| Closed | Madeira Joao C | $100,100 |
Source: Public Records
Tax History Compared to Growth
Tax History
| Year | Tax Paid | Tax Assessment Tax Assessment Total Assessment is a certain percentage of the fair market value that is determined by local assessors to be the total taxable value of land and additions on the property. | Land | Improvement |
|---|---|---|---|---|
| 2025 | $2,777 | $322,500 | $112,300 | $210,200 |
| 2024 | $2,650 | $304,900 | $106,000 | $198,900 |
| 2023 | $2,652 | $289,200 | $106,000 | $183,200 |
| 2022 | $2,613 | $263,900 | $106,000 | $157,900 |
| 2021 | $2,338 | $225,700 | $90,800 | $134,900 |
| 2020 | $2,321 | $223,600 | $100,500 | $123,100 |
| 2019 | $2,526 | $242,900 | $121,100 | $121,800 |
| 2018 | $2,310 | $226,100 | $121,100 | $105,000 |
| 2017 | $2,156 | $215,200 | $114,200 | $101,000 |
| 2016 | $2,178 | $214,400 | $114,200 | $100,200 |
| 2015 | $2,113 | $208,400 | $106,700 | $101,700 |
| 2014 | $2,006 | $196,500 | $96,800 | $99,700 |
Source: Public Records
Map
Nearby Homes