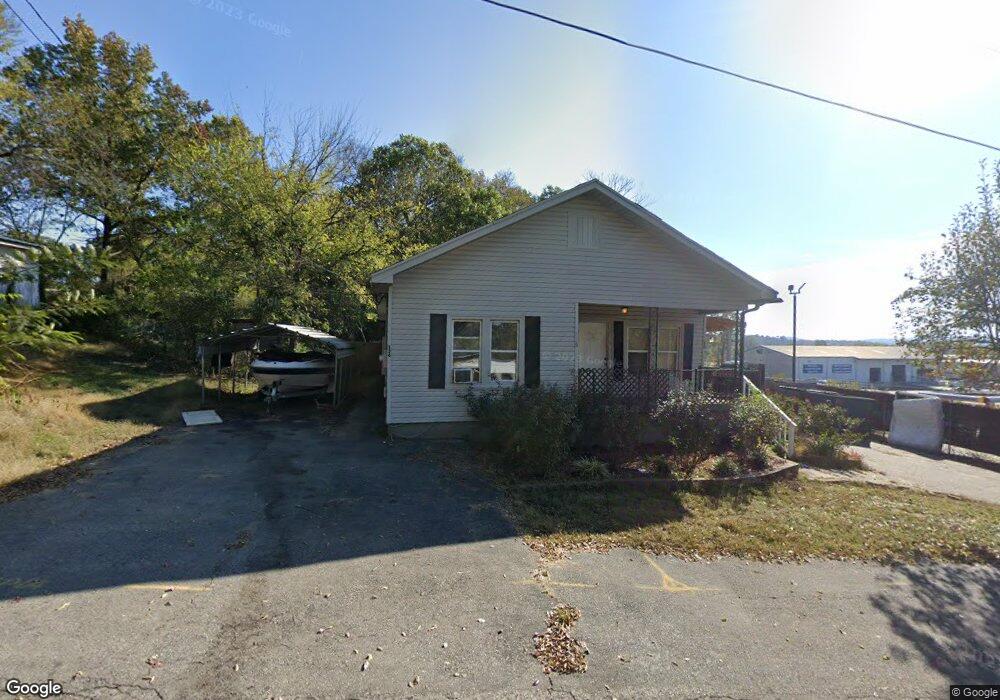
136 Stanage Terrace Hot Springs National Park, AR 71901
Estimated Value: $214,000 - $325,000
2
Beds
3
Baths
1,944
Sq Ft
$127/Sq Ft
Est. Value
About This Home
This home is located at 136 Stanage Terrace, Hot Springs National Park, AR 71901 and is currently estimated at $247,485, approximately $127 per square foot. 136 Stanage Terrace is a home located in Garland County with nearby schools including Lakeside Primary School, Lakeside Intermediate School, and Lakeside Middle School.
Ownership History
Date
Name
Owned For
Owner Type
Purchase Details
Closed on
Dec 9, 2010
Sold by
Smith Marioara Mary and Nemes Marioara Mary
Bought by
Johnson Linda K
Current Estimated Value
Purchase Details
Closed on
Aug 28, 1996
Sold by
Not Provided
Bought by
Smith Marioara Mary
Purchase Details
Closed on
Dec 7, 1994
Sold by
Not Provided
Bought by
Smith Marioara Mary and Smith Truett E
Purchase Details
Closed on
Oct 6, 1993
Sold by
Not Provided
Bought by
Harmon Michael James and Popa Ioan
Purchase Details
Closed on
Feb 16, 1993
Sold by
Not Provided
Bought by
Sferdian Danny
Purchase Details
Closed on
Aug 11, 1992
Sold by
Not Provided
Bought by
Berar Florica
Purchase Details
Closed on
Oct 1, 1991
Sold by
Not Provided
Bought by
Tubbs Charles A and Tubbs Ellen J
Purchase Details
Closed on
Jan 1, 1901
Bought by
Sferdian Danny and 19 Brooktree Ct
Create a Home Valuation Report for This Property
The Home Valuation Report is an in-depth analysis detailing your home's value as well as a comparison with similar homes in the area
Home Values in the Area
Average Home Value in this Area
Purchase History
| Date | Buyer | Sale Price | Title Company |
|---|---|---|---|
| Johnson Linda K | -- | Hot Springs Title Co | |
| Smith Marioara Mary | -- | -- | |
| Smith Marioara Mary | -- | -- | |
| Harmon Michael James | -- | -- | |
| Sferdian Danny | -- | -- | |
| Berar Florica | $19,999 | -- | |
| Tubbs Charles A | -- | -- | |
| Sferdian Danny | -- | -- |
Source: Public Records
Tax History Compared to Growth
Tax History
| Year | Tax Paid | Tax Assessment Tax Assessment Total Assessment is a certain percentage of the fair market value that is determined by local assessors to be the total taxable value of land and additions on the property. | Land | Improvement |
|---|---|---|---|---|
| 2025 | $1,212 | $26,630 | $2,030 | $24,600 |
| 2024 | $1,196 | $26,630 | $2,030 | $24,600 |
| 2023 | $1,151 | $26,630 | $2,030 | $24,600 |
| 2022 | $1,335 | $26,630 | $2,030 | $24,600 |
| 2021 | $1,243 | $21,370 | $2,030 | $19,340 |
| 2020 | $1,243 | $21,370 | $2,030 | $19,340 |
| 2019 | $968 | $21,370 | $2,030 | $19,340 |
| 2018 | $968 | $21,370 | $2,030 | $19,340 |
| 2017 | $874 | $21,370 | $2,030 | $19,340 |
| 2016 | $788 | $19,080 | $1,350 | $17,730 |
| 2015 | $788 | $19,080 | $1,350 | $17,730 |
| 2014 | $788 | $19,080 | $1,350 | $17,730 |
Source: Public Records
Map
Nearby Homes
- xxx Rivermist Point
- 132 Indian Springs Rd
- 248 Elmwood Dr
- 3505 Malvern Rd
- 102 Willman Square
- 137 Parkshores Cir
- 000 Hays St
- 149 Parkshores Cir
- 183 Hays St
- 270 Scroggins Terrace
- 106 Lecroy Rd
- TBD Malvern Rd Unit Tract B
- 171 Maewood Dr
- 149 Scenic Dr
- 204 Leatherwood Loop
- 186 Vanadium Cir
- 202 Lost Lake Point
- 197 Catherine Heights Rd Unit B
- 197 Catherine Heights Rd
- 836 Shady Heights Rd
- 144 Stanage Terrace
- 129 Stanage Terrace
- 127 Stanage Terrace
- 123 Stanage Terrace
- 3701 Malvern Rd
- 3701 Malvern Rd
- 3701 Malvern Ave
- 3701 Malvern Ave
- 240 Indian Springs Rd
- 147 Stanage Terrace
- 115 Stanage Terrace
- 161 Stanage Terrace
- 161 Stanage Terrace Unit 167 Stanage Terrace
- 126 Stanage Terrace
- 3725 Malvern Rd
- 135 Stanage Dr
- 151 Stanage Dr
- 153 Stanage Dr
- 141 Stanage Dr
- 167 Stanage Terrace