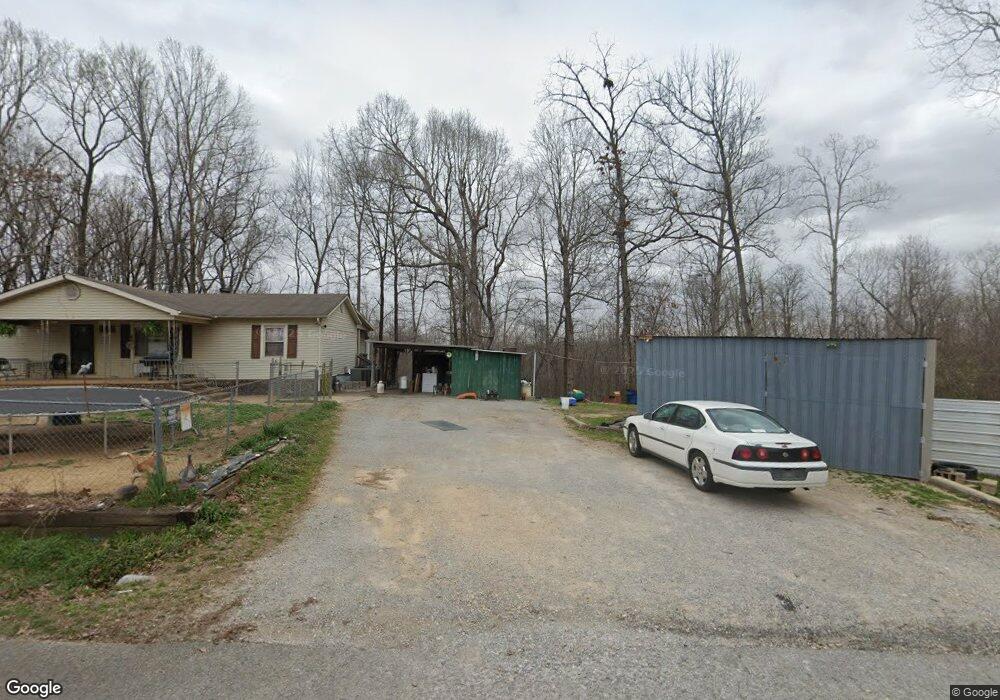
1360 Overhead Bridge Rd Camden, TN 38320
Estimated Value: $75,000 - $187,000
--
Bed
2
Baths
1,359
Sq Ft
$87/Sq Ft
Est. Value
About This Home
This home is located at 1360 Overhead Bridge Rd, Camden, TN 38320 and is currently estimated at $118,793, approximately $87 per square foot. 1360 Overhead Bridge Rd is a home located in Benton County with nearby schools including Camden Elementary School, Briarwood School, and Camden Junior High School.
Ownership History
Date
Name
Owned For
Owner Type
Purchase Details
Closed on
Aug 25, 2016
Sold by
Community Action Network I
Bought by
Christman Jesse
Current Estimated Value
Home Financials for this Owner
Home Financials are based on the most recent Mortgage that was taken out on this home.
Original Mortgage
$25,000
Outstanding Balance
$6,914
Interest Rate
3.48%
Mortgage Type
New Conventional
Estimated Equity
$111,879
Purchase Details
Closed on
Feb 26, 2009
Sold by
Smothers Alvin D
Bought by
Community Action Network Inc
Purchase Details
Closed on
Dec 18, 2007
Bought by
Smothers Alvin and Smothers Linda Smothers
Purchase Details
Closed on
Aug 3, 2007
Sold by
Kee Bobby D
Bought by
Bank Of New York National Trus
Purchase Details
Closed on
Jan 19, 1989
Bought by
Kee Bobby D and Kee Dorathy
Purchase Details
Closed on
Aug 29, 1985
Bought by
Kee J R
Create a Home Valuation Report for This Property
The Home Valuation Report is an in-depth analysis detailing your home's value as well as a comparison with similar homes in the area
Home Values in the Area
Average Home Value in this Area
Purchase History
| Date | Buyer | Sale Price | Title Company |
|---|---|---|---|
| Christman Jesse | $25,000 | -- | |
| Community Action Network Inc | $25,000 | -- | |
| Smothers Alvin | $17,000 | -- | |
| Bank Of New York National Trus | $76,500 | -- | |
| Kee Bobby D | $1,000 | -- | |
| Kee J R | -- | -- |
Source: Public Records
Mortgage History
| Date | Status | Borrower | Loan Amount |
|---|---|---|---|
| Open | Christman Jesse | $25,000 |
Source: Public Records
Tax History Compared to Growth
Tax History
| Year | Tax Paid | Tax Assessment Tax Assessment Total Assessment is a certain percentage of the fair market value that is determined by local assessors to be the total taxable value of land and additions on the property. | Land | Improvement |
|---|---|---|---|---|
| 2025 | $367 | $21,275 | $0 | $0 |
| 2024 | $367 | $13,450 | $1,750 | $11,700 |
| 2023 | $367 | $13,450 | $1,750 | $11,700 |
| 2022 | $361 | $13,250 | $1,750 | $11,500 |
| 2021 | $361 | $13,250 | $1,750 | $11,500 |
| 2020 | $362 | $13,250 | $1,750 | $11,500 |
| 2019 | $387 | $13,125 | $1,750 | $11,375 |
| 2018 | $355 | $13,125 | $1,750 | $11,375 |
| 2017 | $518 | $17,550 | $1,750 | $15,800 |
| 2016 | $0 | $17,550 | $1,750 | $15,800 |
| 2015 | $630 | $21,060 | $2,100 | $18,960 |
| 2014 | -- | $21,060 | $2,100 | $18,960 |
| 2013 | -- | $0 | $0 | $0 |
Source: Public Records
Map
Nearby Homes
- 6010 Highway 70 W
- 160 Ginger Ln
- 3295 Mount Carmel Rd
- 3150 Highway 70 W
- 335 Mount Carmel Rd
- 77 Highway 641 S
- 103 Highway 641 N
- 435 Bills Dr
- 1 Post Oak Rd
- 2642 Mount Carmel Rd
- 000 Blackberry Rd
- 166 Westview St
- 144 Post Oak Ave
- 180 Post Oak Ave
- 172 W Main St
- 107 Melton Ave
- 156 W Main St
- 424 Firetower Rd
- 1905 Post Oak Rd
- 65 Sandy Point Rd
- 1380 Overhead Bridge Rd
- 1335 Overhead Bridge Rd
- 1295 Overhead Bridge Rd
- 2276 W 70
- 2316 Highway 70 W
- 2280 Highway 70 W
- 2315 Highway 70 W
- 2410 W 70
- 2275 Highway 70 W
- 2150 Highway 70 W
- 2355 Highway 70 W
- 2090 Highway 70 W
- 2470 Highway 70 W
- 2046 Highway 70 W
- 2085 Highway 70 W
- 2020 Highway 70 W
- 1970 Highway 70 W
- 944 Overhead Bridge Rd
- 955 Overhead Bridge Rd
- 1920 Highway 70 W