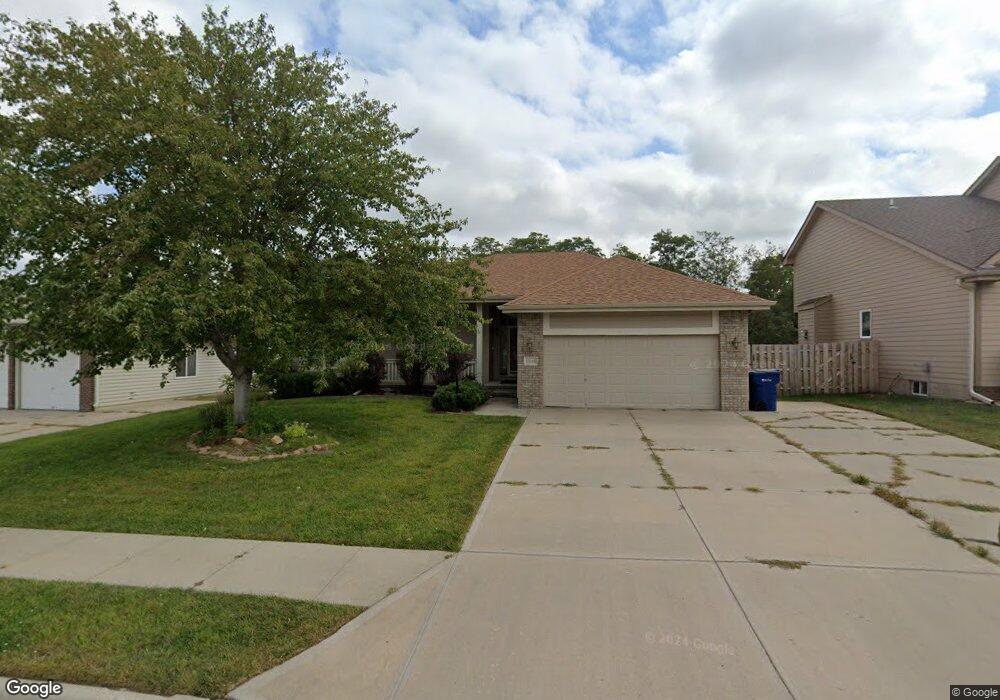
13601 Fornoff Ave Bellevue, NE 68123
Estimated Value: $377,000 - $421,000
4
Beds
4
Baths
3,186
Sq Ft
$124/Sq Ft
Est. Value
About This Home
This home is located at 13601 Fornoff Ave, Bellevue, NE 68123 and is currently estimated at $395,076, approximately $124 per square foot. 13601 Fornoff Ave is a home located in Sarpy County with nearby schools including Bellevue Elementary School, Lewis & Clark Middle School, and Bellevue West High School.
Ownership History
Date
Name
Owned For
Owner Type
Purchase Details
Closed on
Jun 15, 2009
Sold by
Rein George and Rein Kerri
Bought by
Lawson Scott A
Current Estimated Value
Home Financials for this Owner
Home Financials are based on the most recent Mortgage that was taken out on this home.
Original Mortgage
$248,400
Outstanding Balance
$158,628
Interest Rate
4.97%
Estimated Equity
$236,448
Purchase Details
Closed on
Sep 6, 2001
Sold by
Pacesetter Homes Inc
Bought by
Rein George and Rein Kerri
Home Financials for this Owner
Home Financials are based on the most recent Mortgage that was taken out on this home.
Original Mortgage
$165,650
Interest Rate
6.96%
Purchase Details
Closed on
Mar 30, 2001
Sold by
Fox Ridge Llc
Bought by
Pacesetter Homes Inc
Create a Home Valuation Report for This Property
The Home Valuation Report is an in-depth analysis detailing your home's value as well as a comparison with similar homes in the area
Home Values in the Area
Average Home Value in this Area
Purchase History
| Date | Buyer | Sale Price | Title Company |
|---|---|---|---|
| Lawson Scott A | $241,000 | Nlta | |
| Rein George | $208,000 | -- | |
| Pacesetter Homes Inc | $28,000 | -- |
Source: Public Records
Mortgage History
| Date | Status | Borrower | Loan Amount |
|---|---|---|---|
| Open | Lawson Scott A | $248,400 | |
| Previous Owner | Rein George | $165,650 |
Source: Public Records
Tax History Compared to Growth
Tax History
| Year | Tax Paid | Tax Assessment Tax Assessment Total Assessment is a certain percentage of the fair market value that is determined by local assessors to be the total taxable value of land and additions on the property. | Land | Improvement |
|---|---|---|---|---|
| 2025 | $6,477 | $380,037 | $58,000 | $322,037 |
| 2024 | $7,487 | $373,287 | $52,000 | $321,287 |
| 2023 | $7,487 | $354,568 | $48,000 | $306,568 |
| 2022 | $7,025 | $326,427 | $46,000 | $280,427 |
| 2021 | $6,465 | $297,209 | $46,000 | $251,209 |
| 2020 | $6,347 | $290,872 | $46,000 | $244,872 |
| 2019 | $6,663 | $284,673 | $46,000 | $238,673 |
| 2018 | $6,163 | $268,564 | $32,000 | $236,564 |
| 2017 | $6,104 | $260,859 | $32,000 | $228,859 |
| 2016 | $5,659 | $245,688 | $32,000 | $213,688 |
| 2015 | $5,346 | $232,545 | $32,000 | $200,545 |
| 2014 | $5,338 | $231,917 | $30,000 | $201,917 |
| 2012 | -- | $226,869 | $30,000 | $196,869 |
Source: Public Records
Map
Nearby Homes
- 3716 Lookingglass Dr
- 13602 S 36th St
- 3508 Jason Cir
- 3504 Sheridan Cir
- 3728 Schuemann Dr
- 3738 Falcon Dr
- 3309 Lookingglass Dr
- 13609 S 42nd Ave
- 3506 Lynnwood Dr
- 13717 S 42nd Ave
- 14010 S 35th St
- 13809 S 42nd Ave
- 4411 Schilling Dr
- 14013 S 35th St
- 4369 Lookingglass Dr
- 13069 S 42nd Ave Unit Lot 49
- 12741 Ridgeview Cir
- 13065 S 42nd Ave Unit Lot 50
- 13061 S 42nd Ave Unit Lot 51
- 4409 Lookingglass Dr
- 13509 Fornoff Ave
- 13603 Fornoff Ave
- 13507 Fornoff Ave
- 13605 Fornoff Ave
- 3707 Helwig Ave
- 13505 Fornoff Ave
- 13604 Fornoff Ave
- 13607 Fornoft Ave
- 13607 Fornoff Ave
- 3709 Helwig Ave
- 3706 Helwig Ave
- 3708 Helwig Ave
- 3711 Helwig Ave
- 13609 Fornoff Ave
- 3708 Fornoff Ave
- 3710 Helwig Ave
- 3707 Sheridan Rd
- 3713 Helwig Ave
- 3709 Sheridan Rd
- 13501 Fornoff Ave