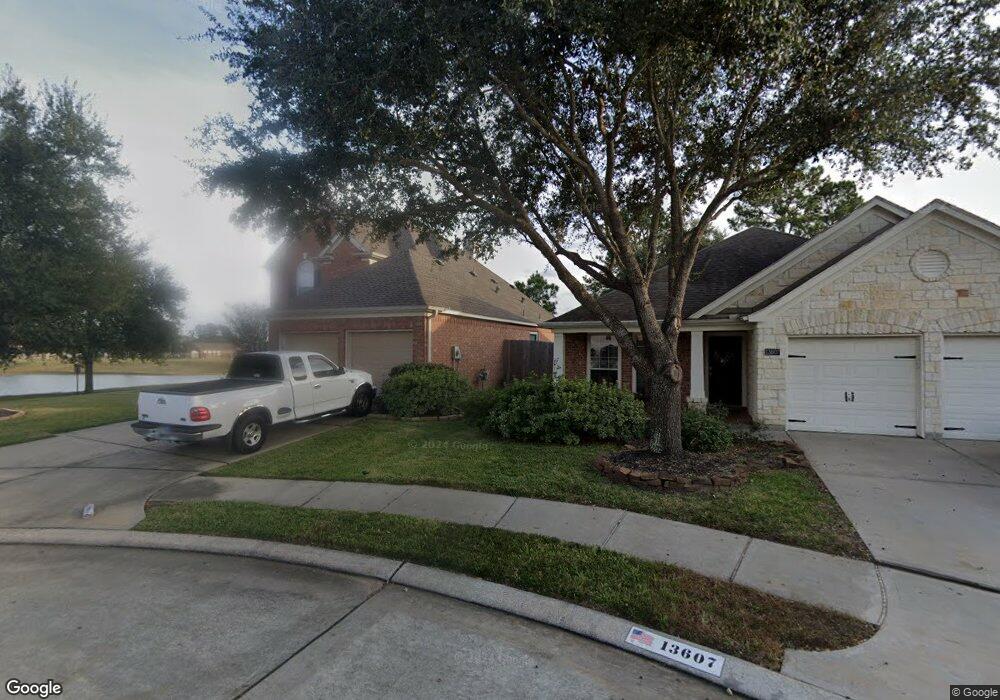
13603 Trailmeadow Ct Cypress, TX 77429
Northpointe NeighborhoodEstimated Value: $354,931 - $392,000
4
Beds
4
Baths
2,570
Sq Ft
$147/Sq Ft
Est. Value
About This Home
This home is located at 13603 Trailmeadow Ct, Cypress, TX 77429 and is currently estimated at $377,733, approximately $146 per square foot. 13603 Trailmeadow Ct is a home located in Harris County with nearby schools including Lakewood Elementary School, Willow Wood Junior High School, and Northpointe Intermediate School.
Ownership History
Date
Name
Owned For
Owner Type
Purchase Details
Closed on
Jun 29, 2012
Sold by
Samstag Joseph A and Samstag Colet A
Bought by
Frost Bank and Emma Jean Mckeehan 867 Trust
Current Estimated Value
Purchase Details
Closed on
May 4, 2010
Sold by
Grounds Gene and Grounds Virgina
Bought by
Samstag Joseph A and Samstag Colet A
Home Financials for this Owner
Home Financials are based on the most recent Mortgage that was taken out on this home.
Original Mortgage
$145,000
Interest Rate
4.93%
Mortgage Type
New Conventional
Purchase Details
Closed on
Jun 23, 2006
Sold by
Perry Homes
Bought by
Grounds Gene and Grounds Virginia
Home Financials for this Owner
Home Financials are based on the most recent Mortgage that was taken out on this home.
Original Mortgage
$155,239
Interest Rate
6.58%
Mortgage Type
Purchase Money Mortgage
Create a Home Valuation Report for This Property
The Home Valuation Report is an in-depth analysis detailing your home's value as well as a comparison with similar homes in the area
Home Values in the Area
Average Home Value in this Area
Purchase History
| Date | Buyer | Sale Price | Title Company |
|---|---|---|---|
| Frost Bank | -- | None Available | |
| Samstag Joseph A | -- | Stewart Title Houston Div | |
| Grounds Gene | -- | Chicago Title |
Source: Public Records
Mortgage History
| Date | Status | Borrower | Loan Amount |
|---|---|---|---|
| Previous Owner | Samstag Joseph A | $145,000 | |
| Previous Owner | Grounds Gene | $155,239 |
Source: Public Records
Tax History Compared to Growth
Tax History
| Year | Tax Paid | Tax Assessment Tax Assessment Total Assessment is a certain percentage of the fair market value that is determined by local assessors to be the total taxable value of land and additions on the property. | Land | Improvement |
|---|---|---|---|---|
| 2025 | $10,671 | $379,925 | $67,813 | $312,112 |
| 2024 | $10,671 | $384,227 | $64,045 | $320,182 |
| 2023 | $10,671 | $406,931 | $64,045 | $342,886 |
| 2022 | $9,617 | $330,525 | $54,627 | $275,898 |
| 2021 | $8,093 | $268,280 | $45,209 | $223,071 |
| 2020 | $7,751 | $247,730 | $45,209 | $202,521 |
| 2019 | $7,712 | $239,972 | $45,209 | $194,763 |
| 2018 | $2,987 | $222,880 | $45,209 | $177,671 |
| 2017 | $7,228 | $222,880 | $45,209 | $177,671 |
| 2016 | $7,228 | $222,880 | $45,209 | $177,671 |
| 2015 | $6,282 | $222,880 | $45,209 | $177,671 |
| 2014 | $6,282 | $186,632 | $45,209 | $141,423 |
Source: Public Records
Map
Nearby Homes
- 13710 Brahman Valley Ct
- 13730 Brahman Valley Ct
- 14418 Cobalt Bend Trail
- 13507 Marble Pointe Ln
- 13915 Springmint Dr
- 13526 Astley Acres Ln
- 13423 Astley Acres Ln
- 13503 Copeland Oaks Blvd
- 13330 Cypress Palms Ct
- 13614 Gainesway Dr
- 14311 Lakepointe Bend Ln
- 14415 Santee Pass Dr
- 14102 Pawnee Bend Dr
- 13718 Gainesway Dr
- 13307 Cypress Pond Dr
- 12810 Wondering Forest Dr
- 14011 Blackfoot Trail Run
- 12943 Spring Cypress Rd
- 14018 Fair Glade Ln
- TBD Grant Rd
- 13607 Trailmeadow Ct
- 13611 Trailmeadow Ct
- 13615 Trailmeadow Ct
- 14122 Englewood Park Ln
- 13602 Trailmeadow Ct
- 13619 Trailmeadow Ct
- 14118 Englewood Park Ln
- 13606 Trailmeadow Ct
- 13610 Trailmeadow Ct
- 13614 Trailmeadow Ct
- 14114 Englewood Park Ln
- 13618 Trailmeadow Ct
- 14110 Englewood Park Ln
- 14103 Englewood Park Ln
- 14102 Englewood Park Ln
- 13615 Barons Lake Ln
- 13619 Barons Lake Ln
- 13611 Barons Lake Ln
- 14131 Englewood Park Ln
- 14127 Englewood Park Ln