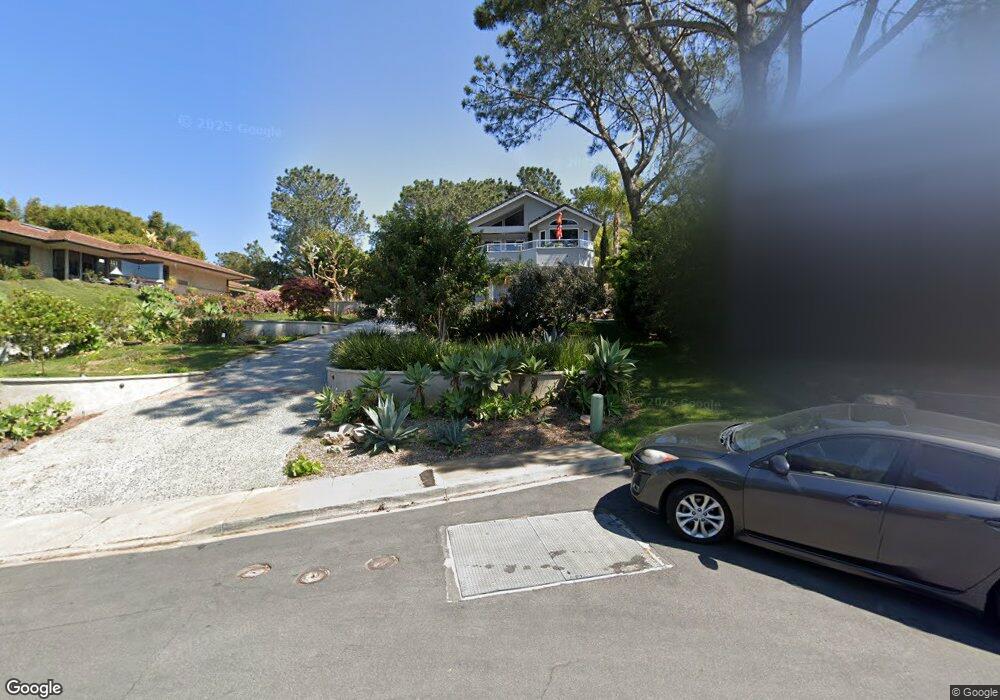
13605 Pine Needles Dr Del Mar, CA 92014
Del Mar Heights NeighborhoodEstimated Value: $3,697,000 - $5,692,000
4
Beds
3
Baths
3,267
Sq Ft
$1,322/Sq Ft
Est. Value
About This Home
This home is located at 13605 Pine Needles Dr, Del Mar, CA 92014 and is currently estimated at $4,319,928, approximately $1,322 per square foot. 13605 Pine Needles Dr is a home located in San Diego County with nearby schools including Del Mar Heights School, Del Mar Hills Elementary School, and Earl Warren Middle School.
Ownership History
Date
Name
Owned For
Owner Type
Purchase Details
Closed on
Apr 1, 2022
Sold by
Wendy Wen Hsin Separate Trust
Bought by
Wendy Wen Hsin Shih Separate Trust
Current Estimated Value
Home Financials for this Owner
Home Financials are based on the most recent Mortgage that was taken out on this home.
Original Mortgage
$350,000
Outstanding Balance
$330,179
Interest Rate
4.67%
Mortgage Type
New Conventional
Estimated Equity
$3,989,749
Purchase Details
Closed on
Apr 13, 2017
Sold by
Hunter Vanessa
Bought by
Shih Wendy Wen Hsin and The Wendy Wen Hsin Shih Separate Trust
Purchase Details
Closed on
Aug 24, 2016
Sold by
Hunter Vanessa
Bought by
Hunter Vanessa
Purchase Details
Closed on
Mar 15, 2001
Sold by
Ryan Thomas J and Ryan Jill R
Bought by
Ryan Thomas J and Ryan Jill R
Purchase Details
Closed on
Apr 24, 1984
Create a Home Valuation Report for This Property
The Home Valuation Report is an in-depth analysis detailing your home's value as well as a comparison with similar homes in the area
Home Values in the Area
Average Home Value in this Area
Purchase History
| Date | Buyer | Sale Price | Title Company |
|---|---|---|---|
| Wendy Wen Hsin Shih Separate Trust | -- | Placer Title | |
| Shih Wendy Wen Hsin | $2,025,000 | Lawyers Title | |
| Hunter Vanessa | -- | None Available | |
| Ryan Thomas J | -- | -- | |
| -- | $235,000 | -- |
Source: Public Records
Mortgage History
| Date | Status | Borrower | Loan Amount |
|---|---|---|---|
| Open | Wendy Wen Hsin Shih Separate Trust | $350,000 |
Source: Public Records
Tax History Compared to Growth
Tax History
| Year | Tax Paid | Tax Assessment Tax Assessment Total Assessment is a certain percentage of the fair market value that is determined by local assessors to be the total taxable value of land and additions on the property. | Land | Improvement |
|---|---|---|---|---|
| 2025 | $24,623 | $2,350,182 | $1,914,965 | $435,217 |
| 2024 | $24,623 | $2,304,101 | $1,877,417 | $426,684 |
| 2023 | $24,079 | $2,258,923 | $1,840,605 | $418,318 |
| 2022 | $23,767 | $2,171,208 | $1,769,133 | $402,075 |
| 2021 | $22,890 | $2,171,208 | $1,769,133 | $402,075 |
| 2020 | $23,092 | $2,148,946 | $1,750,993 | $397,953 |
| 2019 | $22,637 | $2,106,810 | $1,716,660 | $390,150 |
| 2018 | $21,635 | $2,065,500 | $1,683,000 | $382,500 |
| 2017 | $80 | $2,040,000 | $1,581,000 | $459,000 |
| 2016 | $8,545 | $829,909 | $350,031 | $479,878 |
| 2015 | $8,416 | $817,444 | $344,774 | $472,670 |
| 2014 | $8,241 | $801,433 | $338,021 | $463,412 |
Source: Public Records
Map
Nearby Homes
- 13635 Pine Needles Dr
- 13730 Condesa Dr
- 13765 Condesa Dr
- 404 Pine Needles Dr
- 390 Hidden Pines Rd
- 271 Ocean View Ave
- 2122 Del Mar Heights Rd
- 00000 Hidden Pines Rd
- 262 Ocean View Ave
- 13774 Recuerdo Dr
- 119 Spinnaker Ct
- 354 Ocean View Ave
- 14014 Rue d Antibes
- 531 Camino Del Mar
- 541 & 543 Camino Del Mar
- 13754 Mango Dr Unit 111
- 13754 Mango Dr Unit 316
- 13735 Mango Dr Unit 212
- 13132 Caminito Mar Villa
- 2191 Caminito Del Barco
- 501 Pine Needles Dr
- 13625 Pine Needles Dr
- 497 Pine Needles Dr
- 13612 Nogales Dr
- 13602 Nogales Dr
- 13622 Nogales Dr
- 13645 Pine Needles Dr
- 13632 Nogales Dr
- 491 Pine Needles Dr
- 13642 Nogales Dr
- 120 Ocean View Ave
- 13610 Pine Needles Dr
- 13655 Pine Needles Dr
- 13652 Nogales Dr
- 13624 Pine Needles Dr
- 13665 Pine Needles Dr
- 13598 Nogales Dr
- 2186 Pinar Place
- 13658 Nogales Dr
- 132 Ocean View Ave