Estimated Value: $351,000 - $550,000
3
Beds
2
Baths
1,198
Sq Ft
$395/Sq Ft
Est. Value
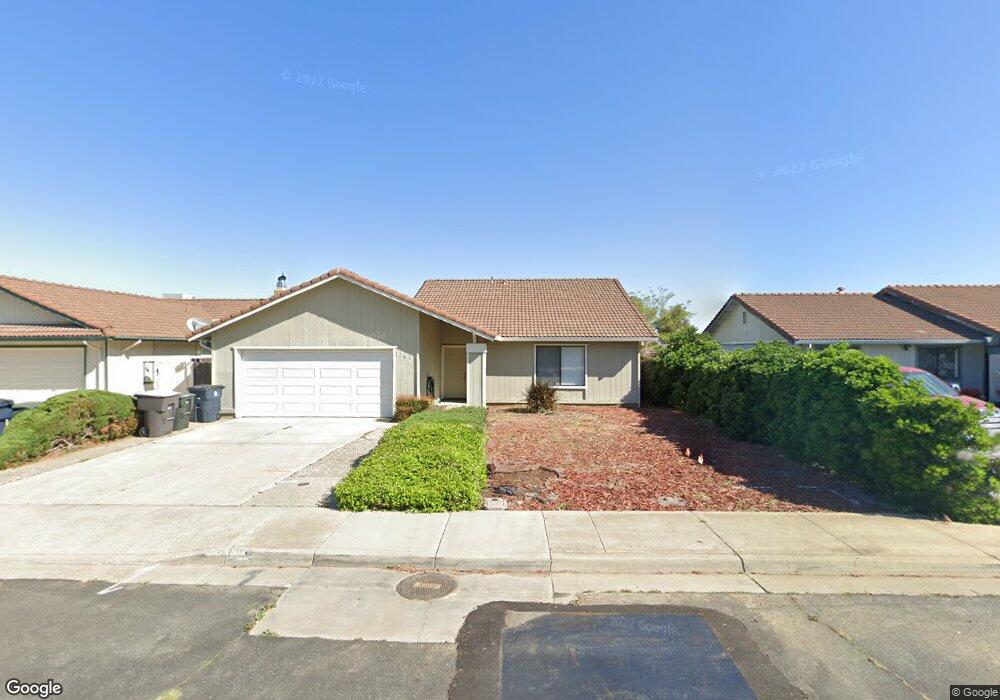
About This Home
This home is located at 1361 Dronero Way, Tracy, CA 95376 and is currently estimated at $473,408, approximately $395 per square foot. 1361 Dronero Way is a home located in San Joaquin County with nearby schools including Melville S. Jacobson Elementary School, Monte Vista Middle School, and Merrill F. West High School.
Ownership History
Date
Name
Owned For
Owner Type
Purchase Details
Closed on
Feb 17, 2021
Sold by
Lee Randall E and Lee Christina M
Bought by
Dandar Investments Llc
Current Estimated Value
Purchase Details
Closed on
Feb 3, 2021
Sold by
Lee Randall E and Lee Christina M
Bought by
Lee Randall E and Lee Christina M
Purchase Details
Closed on
Nov 28, 2007
Sold by
Lee Edward R and Lee Rose Marie T
Bought by
Lee Randall E and Lee Christina M
Create a Home Valuation Report for This Property
The Home Valuation Report is an in-depth analysis detailing your home's value as well as a comparison with similar homes in the area
Home Values in the Area
Average Home Value in this Area
Purchase History
| Date | Buyer | Sale Price | Title Company |
|---|---|---|---|
| Dandar Investments Llc | -- | None Available | |
| Lee Randall E | $404,545 | None Available | |
| Lee Randall E | -- | None Available |
Source: Public Records
Tax History
| Year | Tax Paid | Tax Assessment Tax Assessment Total Assessment is a certain percentage of the fair market value that is determined by local assessors to be the total taxable value of land and additions on the property. | Land | Improvement |
|---|---|---|---|---|
| 2025 | $2,047 | $176,584 | $79,631 | $96,953 |
| 2024 | $1,887 | $173,122 | $78,070 | $95,052 |
| 2023 | $1,858 | $169,729 | $76,540 | $93,189 |
| 2022 | $1,820 | $166,402 | $75,040 | $91,362 |
| 2021 | $1,799 | $163,140 | $73,569 | $89,571 |
| 2020 | $1,787 | $161,468 | $72,815 | $88,653 |
| 2019 | $1,759 | $158,303 | $71,388 | $86,915 |
| 2018 | $1,730 | $155,200 | $69,989 | $85,211 |
| 2017 | $1,644 | $152,158 | $68,617 | $83,541 |
| 2016 | $1,664 | $149,176 | $67,272 | $81,904 |
| 2014 | $1,555 | $144,058 | $64,964 | $79,094 |
Source: Public Records
Map
Nearby Homes
- 2901 San Rocco Ct
- 812 W Clover Rd Unit 51
- 812 W Clover Rd Unit 66
- 2270 Chester Dr
- 3241 Arnaudo Ln
- 2214 Morningside Ct
- 2198 Walsingham Ct
- 435 W Clover Rd
- 522 W Grant Line Rd
- 508 W Grant Line Rd
- 875 Westleigh Ct
- 335 W Clover Rd
- 1974 Paradise Valley Ct
- 262 Clover Rd
- 1861 Mcpeak Ct
- 41 W Kavanagh Ave
- 2935 Holly Dr
- 1930 Wall St
- 1823 Wall St
- 539 W Lowell Ave
- 1331 Dronero Way
- 1391 Dronero Way
- 1291 Dronero Way
- 1401 Dronero Way
- 1360 Dronero Way
- 1390 Dronero Way
- 1330 Dronero Way
- 1261 Dronero Way
- 1431 Dronero Way
- 1400 Dronero Way
- 1290 Dronero Way
- 1430 Dronero Way
- 1231 Dronero Way
- 1461 Dronero Way
- 2980 San Rocco Ct
- 1260 Dronero Way
- 2990 San Rocco Ct
- 2981 Loreto Ct
- 2990 Loreto Ct
- 1460 Dronero Way
Your Personal Tour Guide
Ask me questions while you tour the home.