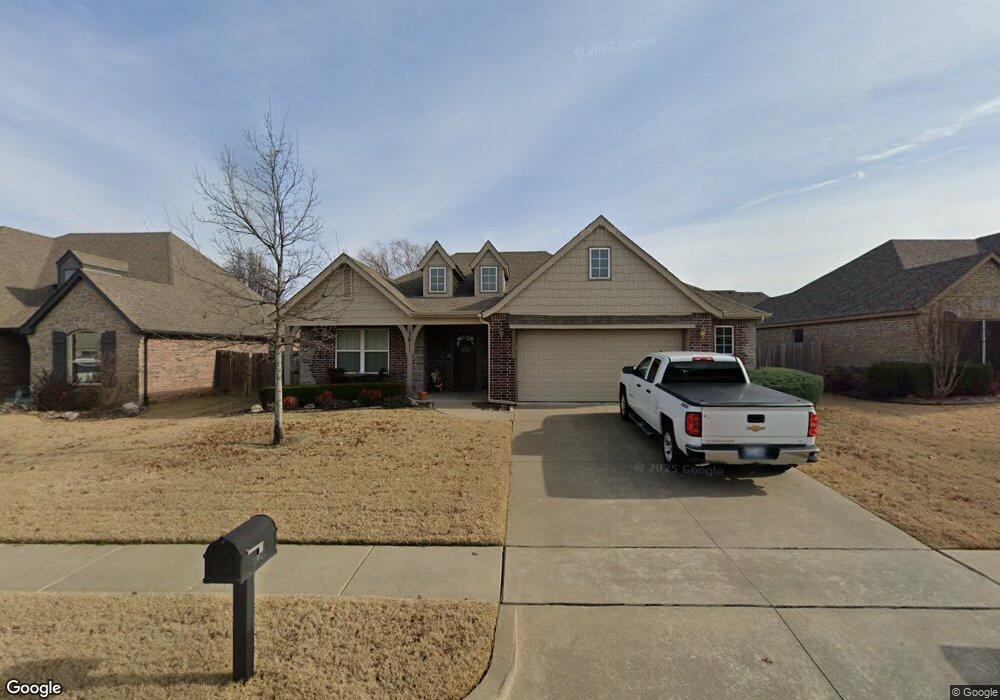
13611 Lansing Ave Glenpool, OK 74033
Estimated Value: $284,556 - $309,000
--
Bed
2
Baths
1,666
Sq Ft
$176/Sq Ft
Est. Value
About This Home
This home is located at 13611 Lansing Ave, Glenpool, OK 74033 and is currently estimated at $293,139, approximately $175 per square foot. 13611 Lansing Ave is a home located in Tulsa County with nearby schools including Glenpool Elementary School, Glenpool Middle School, and Glenpool High School.
Ownership History
Date
Name
Owned For
Owner Type
Purchase Details
Closed on
Oct 27, 2020
Sold by
Cook Jennifer Lynn
Bought by
Carder Steven A and Carder Diana K
Current Estimated Value
Home Financials for this Owner
Home Financials are based on the most recent Mortgage that was taken out on this home.
Original Mortgage
$194,413
Outstanding Balance
$172,136
Interest Rate
2.9%
Mortgage Type
Land Contract Argmt. Of Sale
Estimated Equity
$121,003
Purchase Details
Closed on
Jul 6, 2013
Sold by
Golden Lea Ann
Bought by
Cook Jennifer Lynn
Home Financials for this Owner
Home Financials are based on the most recent Mortgage that was taken out on this home.
Original Mortgage
$181,632
Interest Rate
3.94%
Mortgage Type
New Conventional
Purchase Details
Closed on
Sep 16, 2009
Sold by
Glen Abby Corp
Bought by
Vantage Pointe Resources Llc
Home Financials for this Owner
Home Financials are based on the most recent Mortgage that was taken out on this home.
Original Mortgage
$146,625
Interest Rate
5.12%
Mortgage Type
Construction
Create a Home Valuation Report for This Property
The Home Valuation Report is an in-depth analysis detailing your home's value as well as a comparison with similar homes in the area
Home Values in the Area
Average Home Value in this Area
Purchase History
| Date | Buyer | Sale Price | Title Company |
|---|---|---|---|
| Carder Steven A | $198,000 | American Eagle Title Group | |
| Cook Jennifer Lynn | $178,000 | Main Street Title Co Llc | |
| Vantage Pointe Resources Llc | $32,500 | First Amer Title & Abs Co |
Source: Public Records
Mortgage History
| Date | Status | Borrower | Loan Amount |
|---|---|---|---|
| Open | Carder Steven A | $194,413 | |
| Previous Owner | Cook Jennifer Lynn | $181,632 | |
| Previous Owner | Vantage Pointe Resources Llc | $146,625 |
Source: Public Records
Tax History Compared to Growth
Tax History
| Year | Tax Paid | Tax Assessment Tax Assessment Total Assessment is a certain percentage of the fair market value that is determined by local assessors to be the total taxable value of land and additions on the property. | Land | Improvement |
|---|---|---|---|---|
| 2025 | $3,023 | $25,213 | $2,879 | $22,334 |
| 2024 | $2,677 | $24,012 | $2,803 | $21,209 |
| 2023 | $2,677 | $22,869 | $2,908 | $19,961 |
| 2022 | $2,510 | $21,780 | $3,575 | $18,205 |
| 2021 | $2,549 | $21,780 | $3,575 | $18,205 |
| 2020 | $2,191 | $18,580 | $3,392 | $15,188 |
| 2019 | $2,206 | $18,580 | $3,392 | $15,188 |
| 2018 | $2,196 | $18,580 | $3,392 | $15,188 |
| 2017 | $2,149 | $19,580 | $3,575 | $16,005 |
| 2016 | $2,171 | $19,580 | $3,575 | $16,005 |
| 2015 | $2,159 | $19,580 | $3,575 | $16,005 |
| 2014 | $2,169 | $19,580 | $3,575 | $16,005 |
Source: Public Records
Map
Nearby Homes
- 13608 S Lansing Ave
- 13619 S Lansing Ave
- 13672 S Kenosha Ave
- 13642 S Iroquois Ave
- 2355 E 135th Place
- 13520 S Poplar Ct
- 13959 S Poplar St
- 13761 S Nyssa Ct
- 1289 E 139th St
- 13821 S Nyssa Ct
- 13857 S Nyssa Ct
- 14969 S Poplar Place
- 15025 S Oak St
- 15013 S Oak St
- 13846 S Nyssa Place
- 1286 E 140th Place
- 1221 E 134th St
- 1323 E 143rd St
- 1024 E 135th Place
- 13039 S Birch St
- 13609 Lansing Ave
- 13615 Lansing Ave
- 13609 S Lansing Ave
- 13614 Madison Ave
- 13619 Lansing Ave
- 13610 Madison Ave
- 13618 Madison Ave
- 13605 Lansing Ave
- 13612 Lansing Ave
- 13606 Madison Ave
- 13601 Lansing Ave
- 13608 Lansing Ave
- 13616 Lansing Ave
- 13622 Madison Ave
- 13616 S Lansing Ave
- 13623 S Lansing Ave
- 13623 Lansing Ave
- 13604 Lansing Ave
- 13620 Lansing Ave
- 13626 Madison Ave