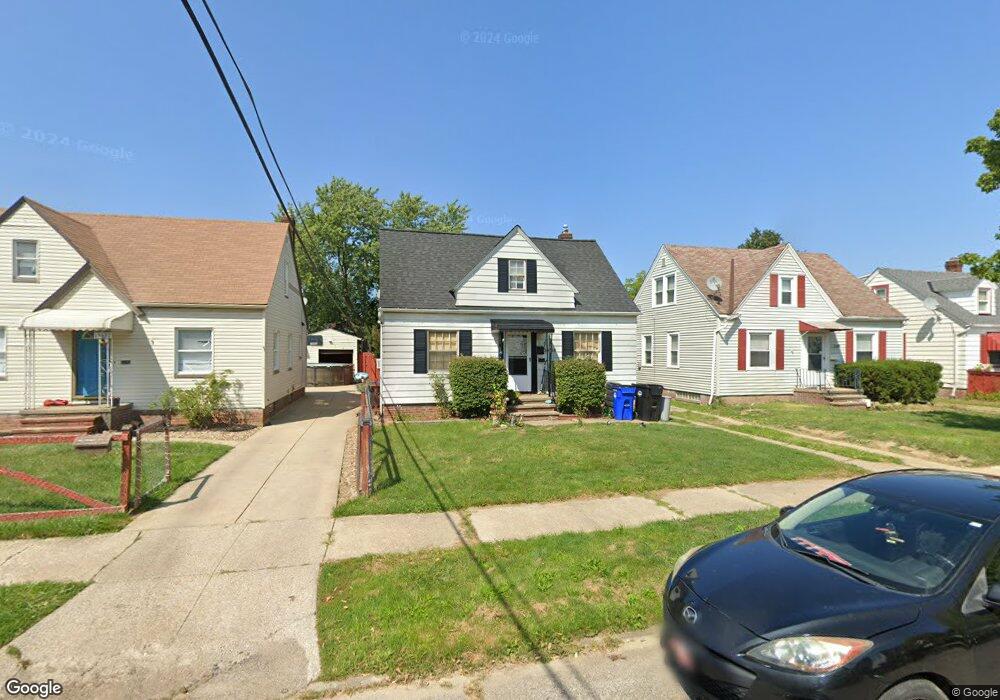
13618 Sherry Ave Cleveland, OH 44135
Bellaire-Puritas NeighborhoodEstimated Value: $123,711 - $150,000
3
Beds
1
Bath
1,098
Sq Ft
$128/Sq Ft
Est. Value
About This Home
This home is located at 13618 Sherry Ave, Cleveland, OH 44135 and is currently estimated at $140,678, approximately $128 per square foot. 13618 Sherry Ave is a home located in Cuyahoga County with nearby schools including Artemus Ward School, Almira Academy, and Benjamin Franklin.
Ownership History
Date
Name
Owned For
Owner Type
Purchase Details
Closed on
Jan 20, 2005
Sold by
Potter Clark Douglas and Potter Clark D
Bought by
Potter Clark Douglas and Potter Clark D
Current Estimated Value
Purchase Details
Closed on
Feb 12, 1997
Sold by
Hitesman Meghan L
Bought by
Richey James R
Home Financials for this Owner
Home Financials are based on the most recent Mortgage that was taken out on this home.
Original Mortgage
$71,400
Outstanding Balance
$7,745
Interest Rate
7.74%
Mortgage Type
VA
Estimated Equity
$132,933
Purchase Details
Closed on
May 1, 1991
Sold by
Johnston Terri A
Bought by
Hitesman Meghan L
Purchase Details
Closed on
Aug 18, 1986
Sold by
Demarino Ernest
Bought by
Johnston Terri A
Purchase Details
Closed on
Jan 17, 1978
Sold by
Humphrey James R and Humphrey Dorothy J
Bought by
Demarino Ernest
Purchase Details
Closed on
Jan 1, 1975
Bought by
Humphrey James R and Humphrey Dorothy J
Create a Home Valuation Report for This Property
The Home Valuation Report is an in-depth analysis detailing your home's value as well as a comparison with similar homes in the area
Home Values in the Area
Average Home Value in this Area
Purchase History
| Date | Buyer | Sale Price | Title Company |
|---|---|---|---|
| Potter Clark Douglas | -- | Attorney | |
| Richey James R | $70,000 | -- | |
| Hitesman Meghan L | $45,000 | -- | |
| Johnston Terri A | $42,900 | -- | |
| Demarino Ernest | $32,000 | -- | |
| Humphrey James R | -- | -- |
Source: Public Records
Mortgage History
| Date | Status | Borrower | Loan Amount |
|---|---|---|---|
| Open | Richey James R | $71,400 |
Source: Public Records
Tax History Compared to Growth
Tax History
| Year | Tax Paid | Tax Assessment Tax Assessment Total Assessment is a certain percentage of the fair market value that is determined by local assessors to be the total taxable value of land and additions on the property. | Land | Improvement |
|---|---|---|---|---|
| 2024 | $2,338 | $34,965 | $7,700 | $27,265 |
| 2023 | $2,043 | $26,360 | $5,710 | $20,650 |
| 2022 | $2,032 | $26,360 | $5,710 | $20,650 |
| 2021 | $2,013 | $26,360 | $5,710 | $20,650 |
| 2020 | $1,803 | $20,410 | $4,410 | $16,000 |
| 2019 | $1,670 | $58,300 | $12,600 | $45,700 |
| 2018 | $1,664 | $20,410 | $4,410 | $16,000 |
| 2017 | $1,717 | $20,310 | $3,540 | $16,770 |
| 2016 | $1,704 | $20,310 | $3,540 | $16,770 |
| 2015 | $1,798 | $20,310 | $3,540 | $16,770 |
| 2014 | $1,798 | $21,350 | $3,710 | $17,640 |
Source: Public Records
Map
Nearby Homes
- 4322 W 138th St
- 13402 Saint James Ave
- 13410 Gilmore Ave
- 13313 Highlandview Ave
- 13904 Highlandview Ave
- 4162 Victory Blvd
- 4349 W 132nd St
- 4407 W 140th St
- 4329 W 131st St
- 13209 Liberty Ave
- 13206 Liberty Ave
- 13401 Puritas Ave
- 13810 Clifford Ave
- 12620 Grimsby Ave
- 14212 Leroy Ave
- 14511 Saint James Ave
- 4059 W 130th St
- 13301 Courtland Ave
- 13818 Courtland Ave
- 4046 W 143rd St
- 13614 Sherry Ave
- 13622 Sherry Ave
- 13610 Sherry Ave
- 4289 W 137th St
- 13606 Sherry Ave
- 13601 Harold Ave
- 13537 Harold Ave
- 13605 Harold Ave
- 4285 W 137th St
- 13533 Harold Ave
- 13609 Harold Ave
- 4295 W 137th St
- 13529 Harold Ave
- 13617 Sherry Ave
- 13613 Harold Ave
- 13613 Sherry Ave
- 4281 W 137th St
- 13609 Sherry Ave
- 4299 W 137th St
- 13530 Sherry Ave