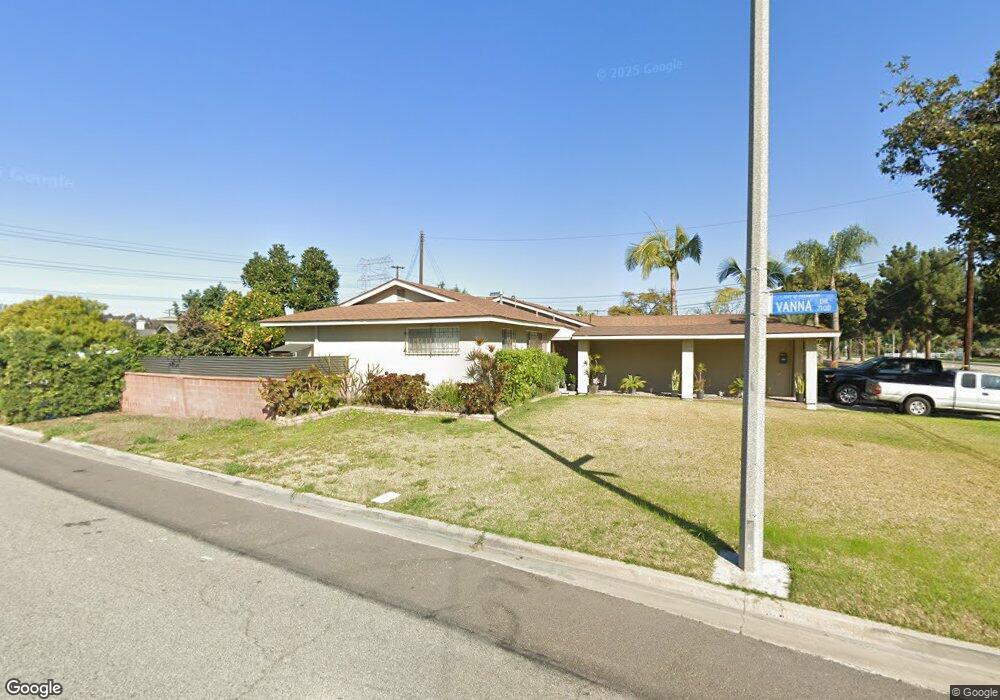
13619 Orange Ave Paramount, CA 90723
Estimated Value: $723,000 - $802,000
4
Beds
2
Baths
1,223
Sq Ft
$626/Sq Ft
Est. Value
About This Home
This home is located at 13619 Orange Ave, Paramount, CA 90723 and is currently estimated at $765,315, approximately $625 per square foot. 13619 Orange Ave is a home located in Los Angeles County with nearby schools including Hollydale School, Alondra Middle School, and Paramount High School.
Ownership History
Date
Name
Owned For
Owner Type
Purchase Details
Closed on
Oct 8, 2010
Sold by
Smith Shaun and Smith Jan
Bought by
Lomeli Juan C and Lomeli Concepcion
Current Estimated Value
Home Financials for this Owner
Home Financials are based on the most recent Mortgage that was taken out on this home.
Original Mortgage
$243,000
Outstanding Balance
$159,372
Interest Rate
4.23%
Mortgage Type
New Conventional
Estimated Equity
$605,943
Purchase Details
Closed on
Jun 13, 2007
Sold by
Holguin Johnny and Holguin Sallie
Bought by
Smith Shaun L
Home Financials for this Owner
Home Financials are based on the most recent Mortgage that was taken out on this home.
Original Mortgage
$400,000
Interest Rate
6.21%
Mortgage Type
Negative Amortization
Purchase Details
Closed on
Jan 7, 1996
Sold by
Holguin Robert and Holguin Jessie
Bought by
Holguin Johnny and Holguin Sallie
Home Financials for this Owner
Home Financials are based on the most recent Mortgage that was taken out on this home.
Original Mortgage
$15,000
Interest Rate
7.36%
Create a Home Valuation Report for This Property
The Home Valuation Report is an in-depth analysis detailing your home's value as well as a comparison with similar homes in the area
Home Values in the Area
Average Home Value in this Area
Purchase History
| Date | Buyer | Sale Price | Title Company |
|---|---|---|---|
| Lomeli Juan C | $270,000 | Old Republic Title Company | |
| Smith Shaun L | $550,000 | Lsi | |
| Holguin Johnny | -- | -- |
Source: Public Records
Mortgage History
| Date | Status | Borrower | Loan Amount |
|---|---|---|---|
| Open | Lomeli Juan C | $243,000 | |
| Previous Owner | Smith Shaun L | $400,000 | |
| Previous Owner | Holguin Johnny | $15,000 |
Source: Public Records
Tax History
| Year | Tax Paid | Tax Assessment Tax Assessment Total Assessment is a certain percentage of the fair market value that is determined by local assessors to be the total taxable value of land and additions on the property. | Land | Improvement |
|---|---|---|---|---|
| 2025 | $4,600 | $345,904 | $253,795 | $92,109 |
| 2024 | $4,600 | $339,122 | $248,819 | $90,303 |
| 2023 | $4,515 | $332,474 | $243,941 | $88,533 |
| 2022 | $4,394 | $325,956 | $239,158 | $86,798 |
| 2021 | $4,292 | $319,566 | $234,469 | $85,097 |
| 2019 | $4,393 | $310,089 | $227,515 | $82,574 |
| 2018 | $4,061 | $304,009 | $223,054 | $80,955 |
| 2016 | $3,644 | $292,206 | $214,394 | $77,812 |
| 2015 | $3,437 | $287,818 | $211,174 | $76,644 |
| 2014 | $3,521 | $282,181 | $207,038 | $75,143 |
Source: Public Records
Map
Nearby Homes
- 13827 Fairlock Ave
- 12323 Edgebrook Ave
- 0 Nevada Ave
- 13944 Brightwell Ave
- 11579 Virginia Ave
- 11363 Virginia Ave
- 13959 Arthur Ave Unit 1
- 11131 Louise Ave
- 11233 Virginia Ave
- 6656 Rosecrans Ave Unit N-10
- 12617 S Halo Dr
- 12029 2nd Ave
- 11138 Linden St
- 8052 Alhambra Ave Unit 36
- 13000 Paramount Blvd
- 4949 E San Carlos St
- 4934 E San Rafael St
- 13108 Brock Ave
- 6556 San Vincente St
- 8032 Rose St Unit 17
- 13611 Orange Ave
- 7129 Vanna Dr
- 7123 Vanna Dr
- 7134 Vanna Dr
- 7140 Vanna Dr
- 13603 Orange Ave
- 7128 Lugo St
- 7130 Vanna Dr
- 7124 Vanna Dr
- 7117 Vanna Dr
- 7122 Lugo St
- 7120 Vanna Dr
- 7111 Vanna Dr
- 7118 Lugo St
- 7129 Cortland Ave
- 7137 Cortland Ave
- 13643 Orange Ave
- 7125 Cortland Ave
- 7114 Vanna Dr
- 13563 Orange Ave
Your Personal Tour Guide
Ask me questions while you tour the home.