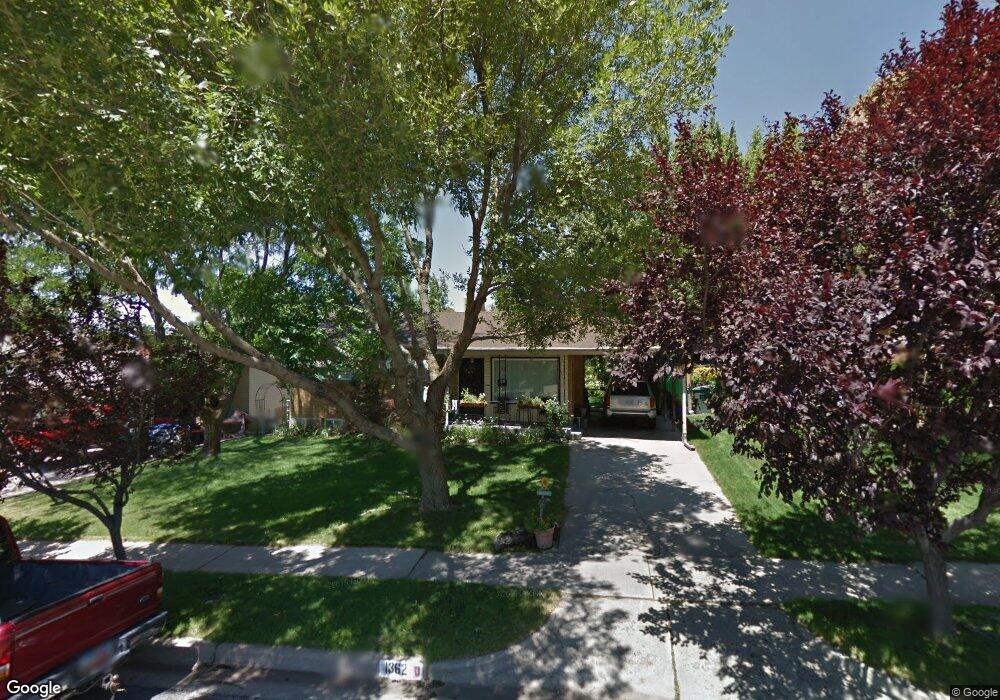
1362 3rd St Ogden, UT 84404
Horace Mann NeighborhoodEstimated Value: $380,126 - $405,000
3
Beds
3
Baths
1,008
Sq Ft
$389/Sq Ft
Est. Value
About This Home
This home is located at 1362 3rd St, Ogden, UT 84404 and is currently estimated at $392,532, approximately $389 per square foot. 1362 3rd St is a home located in Weber County with nearby schools including Mound Fort Junior High School and Ben Lomond High School.
Ownership History
Date
Name
Owned For
Owner Type
Purchase Details
Closed on
Oct 31, 2023
Sold by
Bell Raelyn A
Bought by
Raelyn Bell Living Trust and Bell
Current Estimated Value
Purchase Details
Closed on
Jul 15, 2017
Sold by
Bell Jeffrey A
Bought by
Bell Raelyn A
Home Financials for this Owner
Home Financials are based on the most recent Mortgage that was taken out on this home.
Original Mortgage
$44,225
Interest Rate
3.89%
Mortgage Type
Purchase Money Mortgage
Purchase Details
Closed on
Mar 7, 2011
Sold by
Bell Jeffrey A and Bell Raelyn A
Bought by
Bell Raelyn A and Bell Jeffrey A
Home Financials for this Owner
Home Financials are based on the most recent Mortgage that was taken out on this home.
Original Mortgage
$67,941
Interest Rate
4.75%
Mortgage Type
New Conventional
Purchase Details
Closed on
Oct 29, 2001
Sold by
Bell Jeffrey A and Bell Raelyn L
Bought by
Bell Jeffrey A and Bell Raelyn A
Home Financials for this Owner
Home Financials are based on the most recent Mortgage that was taken out on this home.
Original Mortgage
$60,000
Interest Rate
6.84%
Create a Home Valuation Report for This Property
The Home Valuation Report is an in-depth analysis detailing your home's value as well as a comparison with similar homes in the area
Home Values in the Area
Average Home Value in this Area
Purchase History
| Date | Buyer | Sale Price | Title Company |
|---|---|---|---|
| Raelyn Bell Living Trust | -- | None Listed On Document | |
| Bell Raelyn A | -- | First American Title Ins Co | |
| Bell Raelyn A | -- | First American Layton | |
| Bell Jeffrey A | -- | First American Title Insuran |
Source: Public Records
Mortgage History
| Date | Status | Borrower | Loan Amount |
|---|---|---|---|
| Previous Owner | Bell Raelyn A | $44,225 | |
| Previous Owner | Bell Raelyn A | $67,941 | |
| Previous Owner | Bell Jeffrey A | $60,000 |
Source: Public Records
Tax History
| Year | Tax Paid | Tax Assessment Tax Assessment Total Assessment is a certain percentage of the fair market value that is determined by local assessors to be the total taxable value of land and additions on the property. | Land | Improvement |
|---|---|---|---|---|
| 2025 | $2,816 | $376,780 | $117,150 | $259,630 |
| 2024 | $2,769 | $202,399 | $64,432 | $137,967 |
| 2023 | $2,754 | $204,050 | $59,486 | $144,564 |
| 2022 | $2,704 | $201,850 | $51,367 | $150,483 |
| 2021 | $2,187 | $267,000 | $58,574 | $208,426 |
| 2020 | $2,048 | $230,000 | $43,796 | $186,204 |
| 2019 | $1,927 | $202,000 | $38,873 | $163,127 |
| 2018 | $1,699 | $175,000 | $33,812 | $141,188 |
| 2017 | $1,478 | $140,000 | $31,333 | $108,667 |
| 2016 | $1,423 | $72,758 | $14,704 | $58,054 |
| 2015 | $1,258 | $62,672 | $14,704 | $47,968 |
| 2014 | $1,272 | $62,672 | $14,704 | $47,968 |
Source: Public Records
Map
Nearby Homes
- 1363 Lewis Dr
- 3091 N 3075 W
- 1453 Lewis Dr
- 322 Harrison Blvd
- 1274 5th St
- 3270 N 3325 W Unit 386B
- 1243 Hudson St
- 1090 Harrop St
- 1582 E Maddies Cove Unit 19
- 186 N Harrison Blvd Unit 1
- 1568 Hudson St Unit 1
- 142 S Eccles Ave
- 1062 Hudson St
- 572 S Elena Ln
- 584 Eccles Ave
- 1010 1st St
- 206 N Eccles Ave
- 1149 Dan St
- 1565 E 775 S Unit 7
- 580 Marco Ln
Your Personal Tour Guide
Ask me questions while you tour the home.