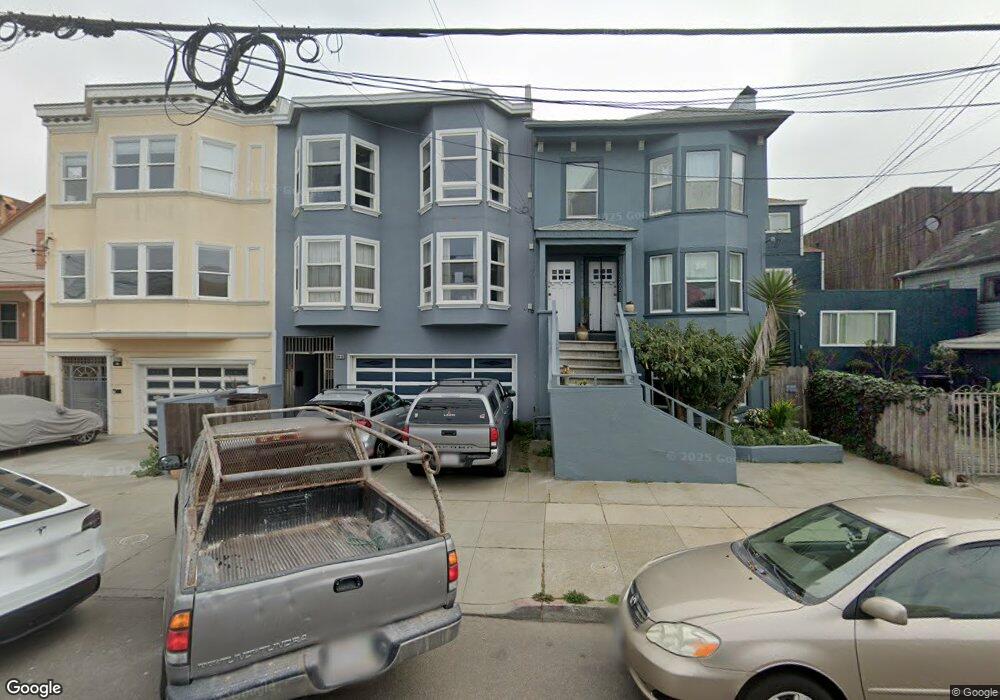
1362 47th Ave San Francisco, CA 94122
Outer Sunset NeighborhoodEstimated Value: $2,088,000 - $2,502,000
12
Beds
6
Baths
4,530
Sq Ft
$527/Sq Ft
Est. Value
About This Home
This home is located at 1362 47th Ave, San Francisco, CA 94122 and is currently estimated at $2,385,808, approximately $526 per square foot. 1362 47th Ave is a home located in San Francisco County with nearby schools including Key (Francis Scott) Elementary School, Giannini (A.P.) Middle School, and Holy Name Elementary School.
Ownership History
Date
Name
Owned For
Owner Type
Purchase Details
Closed on
Nov 2, 2021
Sold by
Luu Jeffrey and Luu Linda
Bought by
Luu Jeffrey and Luu Linda
Current Estimated Value
Home Financials for this Owner
Home Financials are based on the most recent Mortgage that was taken out on this home.
Original Mortgage
$1,200,000
Outstanding Balance
$1,097,902
Interest Rate
2.88%
Mortgage Type
New Conventional
Estimated Equity
$1,287,906
Purchase Details
Closed on
Aug 3, 2016
Sold by
Luu Jeffrey T and Luu Linda
Bought by
Luu Jeffrey T and Luu Linda
Purchase Details
Closed on
Mar 5, 2011
Sold by
Luu Jeffery
Bought by
Luu Jeffery and Luu Linda
Purchase Details
Closed on
Sep 12, 2007
Sold by
Wong Sam H and Wong Leila S
Bought by
Luu Jeffrey and Luu Ngoc K
Home Financials for this Owner
Home Financials are based on the most recent Mortgage that was taken out on this home.
Original Mortgage
$767,500
Interest Rate
7.37%
Mortgage Type
Commercial
Create a Home Valuation Report for This Property
The Home Valuation Report is an in-depth analysis detailing your home's value as well as a comparison with similar homes in the area
Home Values in the Area
Average Home Value in this Area
Purchase History
| Date | Buyer | Sale Price | Title Company |
|---|---|---|---|
| Luu Jeffrey | -- | Timios Title A Ca Corp | |
| Luu Jeffrey | -- | Timios Title A Ca Corp | |
| Luu Jeffrey T | -- | None Available | |
| Luu Jeffery | -- | None Available | |
| Luu Jeffery | -- | None Available | |
| Luu Jeffrey | $1,535,000 | Chicago Title Co |
Source: Public Records
Mortgage History
| Date | Status | Borrower | Loan Amount |
|---|---|---|---|
| Open | Luu Jeffrey | $1,200,000 | |
| Closed | Luu Jeffrey | $767,500 |
Source: Public Records
Tax History Compared to Growth
Tax History
| Year | Tax Paid | Tax Assessment Tax Assessment Total Assessment is a certain percentage of the fair market value that is determined by local assessors to be the total taxable value of land and additions on the property. | Land | Improvement |
|---|---|---|---|---|
| 2025 | $26,839 | $2,223,462 | $1,182,161 | $1,041,301 |
| 2024 | $26,839 | $2,179,866 | $1,158,982 | $1,020,884 |
| 2023 | $23,964 | $1,937,947 | $1,136,257 | $801,690 |
| 2022 | $23,147 | $1,899,949 | $1,113,978 | $785,971 |
| 2021 | $22,740 | $1,862,696 | $1,092,136 | $770,560 |
| 2020 | $22,835 | $1,843,597 | $1,080,938 | $762,659 |
| 2019 | $22,050 | $1,807,449 | $1,059,744 | $747,705 |
| 2018 | $21,307 | $1,772,010 | $1,038,965 | $733,045 |
| 2017 | $20,758 | $1,737,266 | $1,018,594 | $718,672 |
| 2016 | $20,436 | $1,703,203 | $998,622 | $704,581 |
| 2015 | $20,185 | $1,677,620 | $983,622 | $693,998 |
| 2014 | $16,778 | $1,644,759 | $964,355 | $680,404 |
Source: Public Records
Map
Nearby Homes
- 1380 48th Ave
- 4525 Irving St
- 4201 Kirkham St
- 1501 46th Ave
- 1254 48th Ave
- 1501-1503 46th Ave
- 1375 43rd Ave
- 1538 48th Ave
- 1220 La Playa St Unit 204
- 1220 La Playa St Unit 105
- 1220 La Playa St Unit 208
- 1580 Great Hwy Unit 4
- 1563 43rd Ave
- 1586 44th Ave
- 1645 48th Ave
- 4108 Moraga St Unit 4110
- 4229 Moraga St
- 1746 47th Ave
- 3917 Noriega St
- 1783 40th Ave