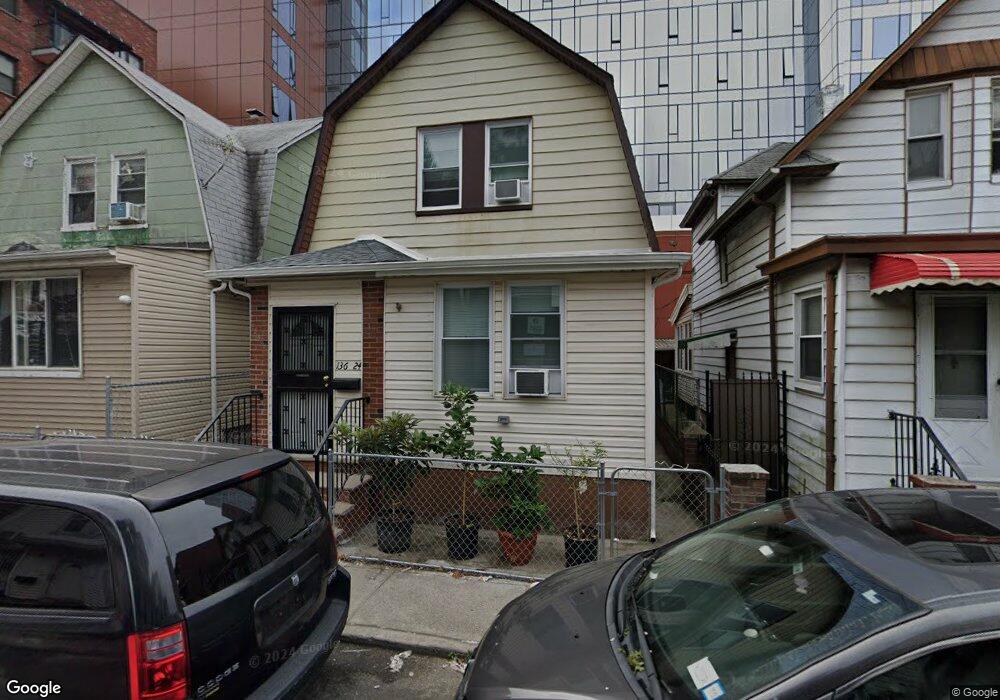
13624 Carlton Place Flushing, NY 11354
Flushing NeighborhoodEstimated Value: $829,000 - $1,006,000
--
Bed
--
Bath
864
Sq Ft
$1,078/Sq Ft
Est. Value
About This Home
This home is located at 13624 Carlton Place, Flushing, NY 11354 and is currently estimated at $931,793, approximately $1,078 per square foot. 13624 Carlton Place is a home located in Queens County with nearby schools including P.S. 214 Cadwallader Colden, Flushing High School, and Promise Christian Academy.
Ownership History
Date
Name
Owned For
Owner Type
Purchase Details
Closed on
Jan 18, 2023
Sold by
Thorsen Esq. Eun C
Bought by
Elite Point Management Llc
Current Estimated Value
Home Financials for this Owner
Home Financials are based on the most recent Mortgage that was taken out on this home.
Original Mortgage
$160,000
Outstanding Balance
$154,785
Interest Rate
6.31%
Mortgage Type
Purchase Money Mortgage
Estimated Equity
$777,008
Purchase Details
Closed on
May 31, 2016
Sold by
Cao Victor and Zao Ping
Bought by
Chen Yu and Zao Ping
Purchase Details
Closed on
Mar 31, 2008
Sold by
Chen Chun Ying and Zao Tsun Wa
Bought by
Zao Ping and Zao Tsun Wa
Purchase Details
Closed on
Jun 29, 1998
Sold by
Flores Carlos A and Flores Dinorah
Bought by
Zao Tsun Wa and Chen Chun Ying
Home Financials for this Owner
Home Financials are based on the most recent Mortgage that was taken out on this home.
Original Mortgage
$112,000
Interest Rate
6.58%
Mortgage Type
Purchase Money Mortgage
Create a Home Valuation Report for This Property
The Home Valuation Report is an in-depth analysis detailing your home's value as well as a comparison with similar homes in the area
Home Values in the Area
Average Home Value in this Area
Purchase History
| Date | Buyer | Sale Price | Title Company |
|---|---|---|---|
| Elite Point Management Llc | $621,132 | -- | |
| Chen Yu | -- | -- | |
| Zao Ping | -- | -- | |
| Zao Tsun Wa | $140,000 | First American Title Ins Co |
Source: Public Records
Mortgage History
| Date | Status | Borrower | Loan Amount |
|---|---|---|---|
| Open | Elite Point Management Llc | $160,000 | |
| Previous Owner | Zao Tsun Wa | $112,000 |
Source: Public Records
Tax History Compared to Growth
Tax History
| Year | Tax Paid | Tax Assessment Tax Assessment Total Assessment is a certain percentage of the fair market value that is determined by local assessors to be the total taxable value of land and additions on the property. | Land | Improvement |
|---|---|---|---|---|
| 2025 | $3,886 | $20,491 | $7,662 | $12,829 |
| 2024 | $3,886 | $19,348 | $7,899 | $11,449 |
| 2023 | $3,886 | $19,348 | $6,666 | $12,682 |
| 2022 | $3,826 | $47,460 | $18,420 | $29,040 |
| 2021 | $3,808 | $46,980 | $18,420 | $28,560 |
| 2020 | $3,614 | $44,160 | $18,420 | $25,740 |
| 2019 | $3,373 | $38,520 | $18,420 | $20,100 |
| 2018 | $3,287 | $16,123 | $7,184 | $8,939 |
| 2017 | $3,256 | $15,972 | $7,441 | $8,531 |
| 2016 | $3,014 | $15,972 | $7,441 | $8,531 |
| 2015 | $1,817 | $14,230 | $6,402 | $7,828 |
| 2014 | $1,817 | $13,436 | $7,121 | $6,315 |
Source: Public Records
Map
Nearby Homes
- 35-06 Leavitt St Unit 3
- 35-06 Leavitt St Unit 7F
- 35-32 Leavitt St Unit PHK
- 35-32 Leavitt St Unit PH I
- 35-32 Leavitt St Unit PH E
- 35-32 Leavitt St Unit PH J
- 35-32 Leavitt St Unit PH A
- 35-32 Leavitt St Unit PH G
- 3506 Leavitt St Unit 5H
- 3506 Leavitt St
- 3506 Leavitt St Unit 3I
- 136-16 35th Ave Unit 2B
- 136-16 35th Ave Unit 7C
- 35-19 Leavitt St Unit 3E
- 138-10 35th Ave Unit 2B
- 138-10 35th Ave Unit 4B
- 135-10 35th Ave Unit 3B
- 138-12 Northern Blvd Unit 3E
- 138-12 Northern Blvd Unit 6B
- 138-12 Northern Blvd Unit 3C
- 136-24 Carlton Place
- 13626 Carlton Place
- 13622 Carlton Place
- 136-26 Carlton Place
- 13620 Carlton Place
- 0 0 Unit 2883697
- 13618 Carlton Place
- 136-25 Carlton Place
- 3520 Leavitt St
- 13623 Carlton Place
- 35-06 Leavitt St Unit 5G
- 35-06 Leavitt St Unit 6
- 35-06 Leavitt St Unit 4I
- 35-06 Leavitt St Unit 4I
- 35-06 Leavitt St Unit 6Fl
- 35-06 Leavitt St Unit 3B
- 35-06 Leavitt St Unit 5K
- 35-06 Leavitt St Unit 5F
- 35-06 Leavitt St Unit 6C
- 35-06 Leavitt St Unit Cf-G