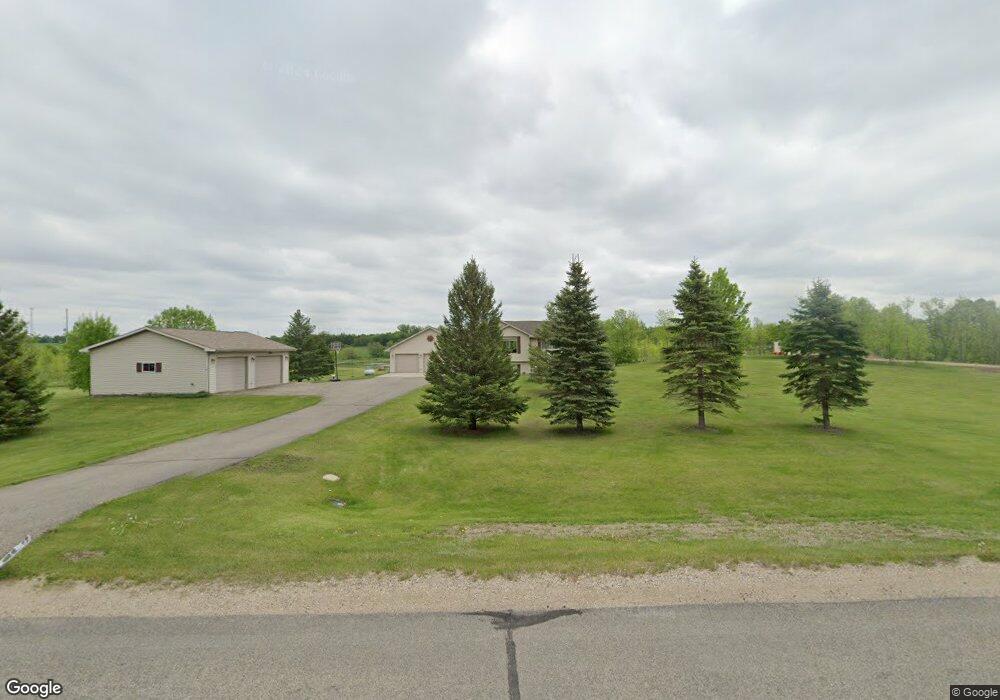
1363 90th St SW Alexandria, MN 56308
Estimated Value: $459,402 - $494,000
5
Beds
3
Baths
1,115
Sq Ft
$425/Sq Ft
Est. Value
About This Home
This home is located at 1363 90th St SW, Alexandria, MN 56308 and is currently estimated at $473,601, approximately $424 per square foot. 1363 90th St SW is a home located in Douglas County with nearby schools including Lincoln Elementary School, Discovery Middle School, and Alexandria Area High School.
Ownership History
Date
Name
Owned For
Owner Type
Purchase Details
Closed on
Jul 29, 2016
Sold by
Mcdonald Jay Jay
Bought by
Linn Jeffrey Jeffrey
Current Estimated Value
Home Financials for this Owner
Home Financials are based on the most recent Mortgage that was taken out on this home.
Original Mortgage
$259,500
Outstanding Balance
$207,051
Interest Rate
3.48%
Estimated Equity
$266,550
Purchase Details
Closed on
Dec 26, 2012
Sold by
Johnson Ricky C and Johnson Brenda L
Bought by
Mcdonald Jay E and Mcdonald Kimberly A
Purchase Details
Closed on
Sep 15, 2006
Sold by
Netland Josh T and Netland Michelle A
Bought by
Johnson Ricky C and Johnson Brenda L
Home Financials for this Owner
Home Financials are based on the most recent Mortgage that was taken out on this home.
Original Mortgage
$140,000
Interest Rate
6.7%
Mortgage Type
New Conventional
Create a Home Valuation Report for This Property
The Home Valuation Report is an in-depth analysis detailing your home's value as well as a comparison with similar homes in the area
Home Values in the Area
Average Home Value in this Area
Purchase History
| Date | Buyer | Sale Price | Title Company |
|---|---|---|---|
| Linn Jeffrey Jeffrey | $260,000 | -- | |
| Mcdonald Jay E | $235,000 | None Available | |
| Johnson Ricky C | $222,000 | None Available |
Source: Public Records
Mortgage History
| Date | Status | Borrower | Loan Amount |
|---|---|---|---|
| Open | Linn Jeffrey Jeffrey | $259,500 | |
| Previous Owner | Johnson Ricky C | $140,000 |
Source: Public Records
Tax History Compared to Growth
Tax History
| Year | Tax Paid | Tax Assessment Tax Assessment Total Assessment is a certain percentage of the fair market value that is determined by local assessors to be the total taxable value of land and additions on the property. | Land | Improvement |
|---|---|---|---|---|
| 2025 | $3,372 | $428,700 | $30,300 | $398,400 |
| 2024 | $3,372 | $414,500 | $30,300 | $384,200 |
| 2023 | $3,290 | $373,800 | $30,300 | $343,500 |
| 2022 | $2,768 | $341,800 | $30,300 | $311,500 |
| 2021 | $2,680 | $288,600 | $30,300 | $258,300 |
| 2020 | $2,642 | $270,500 | $30,300 | $240,200 |
| 2019 | $2,452 | $261,000 | $30,300 | $230,700 |
| 2018 | $2,178 | $249,400 | $30,300 | $219,100 |
| 2017 | $1,980 | $227,600 | $30,300 | $197,300 |
| 2016 | $2,022 | $209,326 | $29,391 | $179,935 |
| 2015 | $2,002 | $0 | $0 | $0 |
| 2014 | -- | $202,300 | $30,300 | $172,000 |
Source: Public Records
Map
Nearby Homes
- 1380 90th St SW
- 7890 Lawnys Cir SW
- 8951 Twin Point Rd SW Unit 69
- 7687 Lindgren Way SW
- 7060 10th Ave SW
- 2012 Brandt's Beach Ct
- TBD Moe Hall Rd NW
- 2221 Reubens Ln SW Unit 29
- 5023 W Lake Mary Dr SW
- 5950 County Road 8 NW
- 7755 Canary Rd SW
- Lot 1 B2 Dixie Ln
- Lot 5 B4 Brittney's Place
- 1346 Faith Hill Dr
- Lot 7 B4 Brittney's Place
- 550 Eldo Ln SW
- 4760 Country Shores SW
- 1702 Brophy Landing NW
- TBD Valley Ln SW
- 7458 39th Ave NW
- 1363 90th St SW
- XXX 90th St SW
- 0 90th St SW
- 1217 90th St SW
- 9091 NE Lobster Dr SW Unit SW
- XXX NE Lobster Dr SW
- 9091 9091 Loster-Drive-sw
- XXXX NE Lobster Dr SW
- 8740 NE Lobster Dr SW Unit SW
- 8752 NE Lobster Dr SW Unit SW
- 8752 NE Lobster Dr SW
- 8660 NE Lobster Dr SW Unit SW
- 8660 NE Lobster Dr SW
- 8780 NE Lobster Dr SW Unit SW
- 0 Block 1 Lot 1 Ne Lobster Dr Unit 5516456
- 0 Block 1 Lot 1 Ne Lobster Dr
- 8580 NE Lobster Dr SW Unit SW
- 8580 NE Lobster Dr SW
- 1101 90th St SW
- 9141 NE Lobster Dr SW Unit SW