Estimated Value: $226,000 - $293,000
3
Beds
2
Baths
1,193
Sq Ft
$215/Sq Ft
Est. Value
About This Home
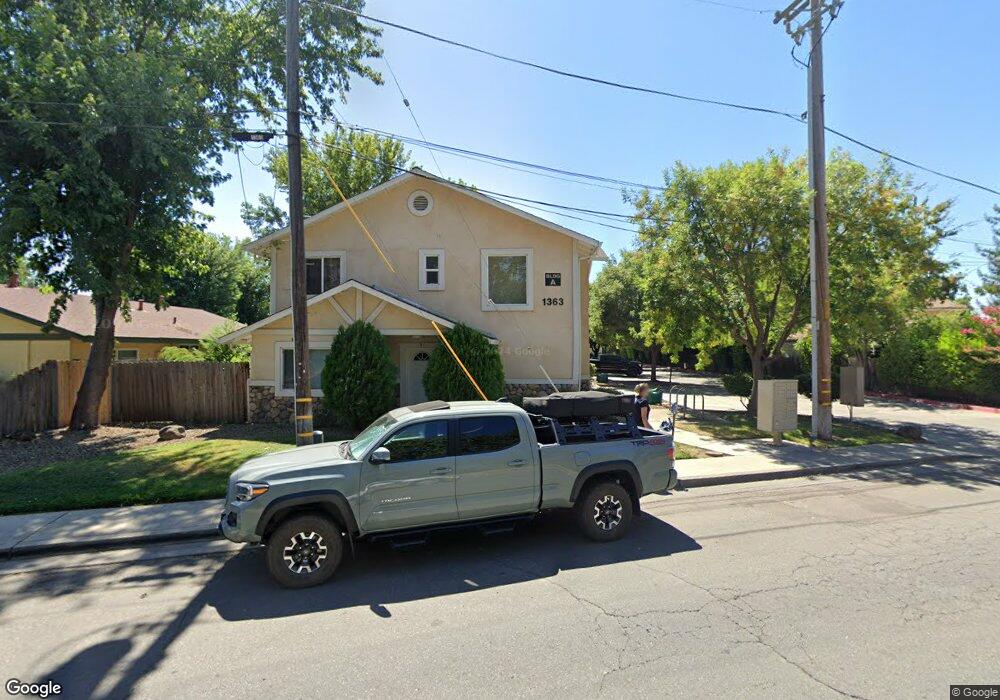
This home is located at 1363 E Lindo Ave Unit 15, Chico, CA 95926 and is currently estimated at $256,343, approximately $214 per square foot. 1363 E Lindo Ave Unit 15 is a home located in Butte County with nearby schools including Neal Dow Elementary School, Bidwell Junior High School, and Pleasant Valley High School.
Ownership History
Date
Name
Owned For
Owner Type
Purchase Details
Closed on
May 31, 2013
Sold by
Vancarter Jonathon
Bought by
Mclaughlin Randy
Current Estimated Value
Purchase Details
Closed on
May 3, 2013
Sold by
Vancarter Jonathan
Bought by
Sandstone Commons Condominiums Homeowner
Purchase Details
Closed on
Jan 29, 2013
Sold by
Vancarter Jonathan
Bought by
Sandstone Commons Condominiums Homeowner
Purchase Details
Closed on
Feb 10, 2010
Sold by
Steffen Tom
Bought by
Vancarter Jonathan
Home Financials for this Owner
Home Financials are based on the most recent Mortgage that was taken out on this home.
Original Mortgage
$168,900
Interest Rate
5.02%
Mortgage Type
Purchase Money Mortgage
Create a Home Valuation Report for This Property
The Home Valuation Report is an in-depth analysis detailing your home's value as well as a comparison with similar homes in the area
Purchase History
| Date | Buyer | Sale Price | Title Company |
|---|---|---|---|
| Mclaughlin Randy | $178,247 | Mid Valley Titel & Escrow Co | |
| Sandstone Commons Condominiums Homeowner | $13,002 | First American Title Company | |
| Sandstone Commons Condominiums Homeowner | $13,002 | First American Title Company | |
| Vancarter Jonathan | $185,000 | Mid Valley Title & Escrow Co |
Source: Public Records
Mortgage History
| Date | Status | Borrower | Loan Amount |
|---|---|---|---|
| Previous Owner | Vancarter Jonathan | $168,900 |
Source: Public Records
Tax History
| Year | Tax Paid | Tax Assessment Tax Assessment Total Assessment is a certain percentage of the fair market value that is determined by local assessors to be the total taxable value of land and additions on the property. | Land | Improvement |
|---|---|---|---|---|
| 2025 | $2,006 | $184,702 | $55,409 | $129,293 |
| 2024 | $2,006 | $181,081 | $54,323 | $126,758 |
| 2023 | $1,982 | $177,531 | $53,258 | $124,273 |
| 2022 | $1,950 | $174,051 | $52,214 | $121,837 |
| 2021 | $1,913 | $170,640 | $51,191 | $119,449 |
| 2020 | $1,908 | $168,892 | $50,667 | $118,225 |
| 2019 | $1,874 | $165,581 | $49,674 | $115,907 |
| 2018 | $1,839 | $162,335 | $48,700 | $113,635 |
| 2017 | $1,802 | $159,153 | $47,746 | $111,407 |
| 2016 | $1,645 | $156,033 | $46,810 | $109,223 |
| 2015 | $1,645 | $153,690 | $46,107 | $107,583 |
| 2014 | $1,605 | $150,680 | $45,204 | $105,476 |
Source: Public Records
Map
Nearby Homes
- 5 Canterbury Cir
- 2 Canterbury Cir
- 1280 Dale Way
- 1277 Howard Dr
- 4 Lakewood Way
- 1094 Manzanita Ave
- 12 Lakewood Way
- 1612 Neal Dow Ave
- 1280 Calla Ln
- 1261 Parque Dr
- 9 Trieste Way
- 0 Us-99
- 1415 Sheridan Ave
- 977 Sarah Ave
- 3 Sunflower Ct
- 1125 Sheridan Ave Unit 37
- 1125 Sheridan Ave
- 1125 Sheridan Ave Unit 36
- 996 E 1st Ave
- 1274 Filbert Ave
- 1363 E Lindo Ave
- 1363 E Lindo Ave Unit 9
- 1363 E Lindo Ave Unit 14
- 1363 E Lindo Ave Unit 13
- 1363 E Lindo Ave Unit 12
- 1363 E Lindo Ave Unit 11
- 1363 E Lindo Ave Unit 10
- 1363 E Lindo Ave Unit 9
- 1363 E Lindo Ave Unit 8
- 1363 E Lindo Ave Unit 7
- 1363 E Lindo Ave Unit 6
- 1363 E Lindo Ave Unit 5
- 1363 E Lindo Ave Unit 4
- 1363 E Lindo Ave Unit 3
- 1363 E Lindo Ave Unit 2
- 1363 E Lindo Ave Unit 1
- 1351 E Lindo Ave
- 1367 E Lindo Ave
- 1295 E 5th Ave
- 1291 E 5th Ave
Your Personal Tour Guide
Ask me questions while you tour the home.