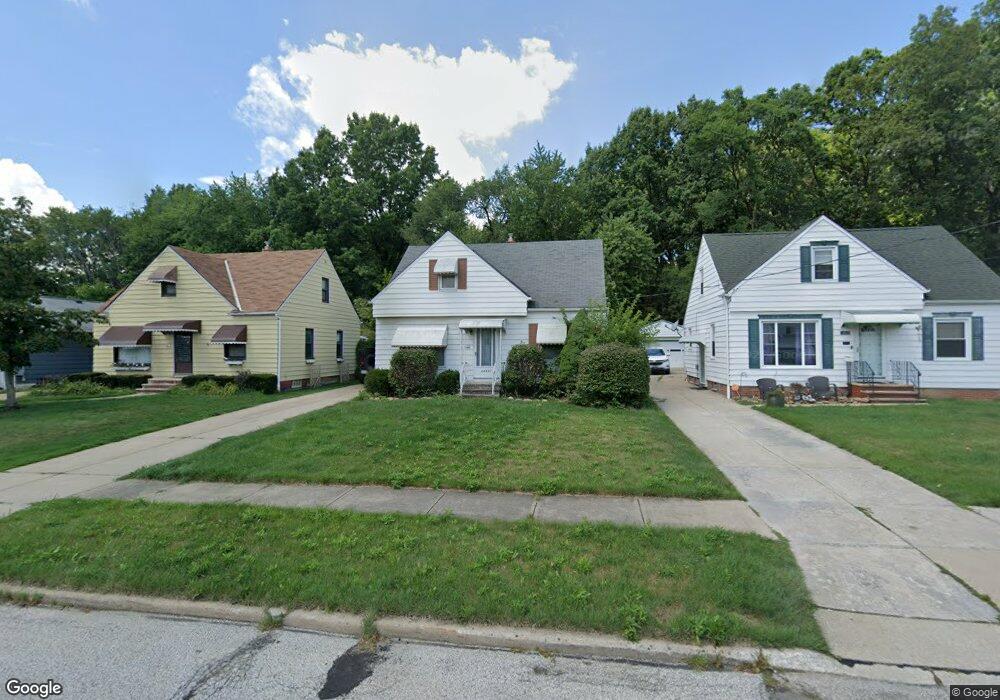
13631 Rybak Ave Cleveland, OH 44125
Estimated Value: $137,000 - $176,000
4
Beds
1
Bath
1,209
Sq Ft
$128/Sq Ft
Est. Value
About This Home
This home is located at 13631 Rybak Ave, Cleveland, OH 44125 and is currently estimated at $154,973, approximately $128 per square foot. 13631 Rybak Ave is a home located in Cuyahoga County with nearby schools including Garfield Heights High School and St Benedict Catholic School.
Ownership History
Date
Name
Owned For
Owner Type
Purchase Details
Closed on
Jan 24, 2014
Sold by
Casadonte Rocco and Spencer Angela
Bought by
Demassimo Lawrence M
Current Estimated Value
Home Financials for this Owner
Home Financials are based on the most recent Mortgage that was taken out on this home.
Original Mortgage
$58,225
Outstanding Balance
$43,850
Interest Rate
4.25%
Mortgage Type
FHA
Estimated Equity
$111,123
Purchase Details
Closed on
Mar 26, 2008
Sold by
Estate Of John A Casadonte
Bought by
Casadonte Rocco and Casadonte Marilyn
Purchase Details
Closed on
Feb 8, 2008
Sold by
Estate Of Mary Casadonte
Bought by
Casadonte Rocco and Casadonte Marilyn
Purchase Details
Closed on
Sep 12, 1977
Sold by
Casadonte Thomas J and Casadonte Mary
Bought by
Casadonte Mary J
Purchase Details
Closed on
Jan 1, 1975
Bought by
Casadonte Thomas J and Casadonte Mary
Create a Home Valuation Report for This Property
The Home Valuation Report is an in-depth analysis detailing your home's value as well as a comparison with similar homes in the area
Home Values in the Area
Average Home Value in this Area
Purchase History
| Date | Buyer | Sale Price | Title Company |
|---|---|---|---|
| Demassimo Lawrence M | $59,300 | Transfer Title | |
| Casadonte Rocco | -- | None Available | |
| Casadonte Rocco | -- | Attorney | |
| Casadonte Mary J | -- | -- | |
| Casadonte Thomas J | -- | -- |
Source: Public Records
Mortgage History
| Date | Status | Borrower | Loan Amount |
|---|---|---|---|
| Open | Demassimo Lawrence M | $58,225 |
Source: Public Records
Tax History Compared to Growth
Tax History
| Year | Tax Paid | Tax Assessment Tax Assessment Total Assessment is a certain percentage of the fair market value that is determined by local assessors to be the total taxable value of land and additions on the property. | Land | Improvement |
|---|---|---|---|---|
| 2024 | $4,339 | $43,505 | $9,380 | $34,125 |
| 2023 | $3,143 | $28,910 | $6,230 | $22,680 |
| 2022 | $3,097 | $28,910 | $6,230 | $22,680 |
| 2021 | $3,276 | $28,910 | $6,230 | $22,680 |
| 2020 | $2,802 | $23,100 | $4,970 | $18,130 |
| 2019 | $2,776 | $66,000 | $14,200 | $51,800 |
| 2018 | $2,892 | $23,100 | $4,970 | $18,130 |
| 2017 | $2,775 | $21,640 | $4,170 | $17,470 |
| 2016 | $2,816 | $21,640 | $4,170 | $17,470 |
| 2015 | $2,705 | $21,640 | $4,170 | $17,470 |
| 2014 | $2,705 | $22,790 | $4,380 | $18,410 |
Source: Public Records
Map
Nearby Homes
- 13578 Foxcroft Dr
- 13577 Robinhood Dr
- 13835 Milo Rd
- TBD Meadowbrook Rd
- 6318 Valley Ranch Dr
- 12955 Milo Rd
- 6133 Turney Rd
- 13732 Carpenter Rd
- 12940 Fruitside Rd
- 13712 Rockside Rd
- 13804 Rockside Rd
- 6378 Valley Ranch Dr
- 6372 Valley Ranch Dr
- 14775 Lisa Dr
- 13101 Littleton Rd
- 12930 Havana Rd
- 14917 Summit Ave
- 14916 Summit Ave
- 13304 Orme Rd
- 185 Creekside Dr
- 13635 Rybak Ave
- 13627 Rybak Ave
- 13639 Rybak Ave
- 13623 Rybak Ave
- 13643 Rybak Ave
- 13619 Rybak Ave
- 13630 Rybak Ave
- 13647 Rybak Ave
- 13634 Rybak Ave
- 13626 Rybak Ave
- 13615 Rybak Ave
- 13638 Rybak Ave
- 13622 Rybak Ave
- 13642 Rybak Ave
- 13618 Rybak Ave
- 13703 Rybak Ave
- 13646 Rybak Ave
- 13614 Rybak Ave
- 13707 Rybak Ave
- 13702 Rybak Ave