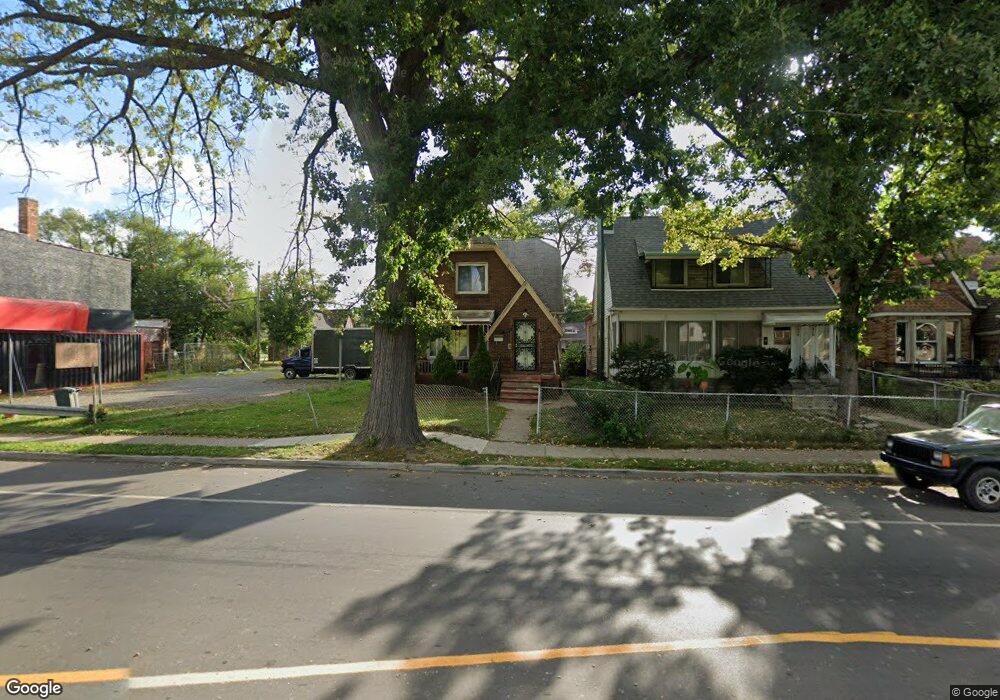
13632 Meyers Rd Unit Bldg-Unit Detroit, MI 48227
Grand River-I96 NeighborhoodEstimated Value: $32,000 - $141,000
--
Bed
2
Baths
1,660
Sq Ft
$42/Sq Ft
Est. Value
About This Home
This home is located at 13632 Meyers Rd Unit Bldg-Unit, Detroit, MI 48227 and is currently estimated at $69,145, approximately $41 per square foot. 13632 Meyers Rd Unit Bldg-Unit is a home located in Wayne County with nearby schools including Noble Elementary-Middle School, Charles L. Spain Elementary-Middle School, and Edward 'Duke' Ellington Conservatory of Music and Art.
Ownership History
Date
Name
Owned For
Owner Type
Purchase Details
Closed on
Jan 21, 2025
Sold by
Pritchett Terrence
Bought by
We Design & Build Llc
Current Estimated Value
Home Financials for this Owner
Home Financials are based on the most recent Mortgage that was taken out on this home.
Original Mortgage
$61,500
Outstanding Balance
$61,076
Interest Rate
6.85%
Mortgage Type
Credit Line Revolving
Estimated Equity
$8,069
Purchase Details
Closed on
Jul 12, 2018
Sold by
Secretary Of Housing And Urban Developme
Bought by
Cuan Sebastian
Purchase Details
Closed on
Nov 15, 2016
Sold by
Frazier Eugene and Frazier Lorrain
Bought by
United States Secretary Of Housing And U
Purchase Details
Closed on
Dec 20, 2014
Sold by
Frazier Eugene
Bought by
Parker Deborah Lee
Create a Home Valuation Report for This Property
The Home Valuation Report is an in-depth analysis detailing your home's value as well as a comparison with similar homes in the area
Home Values in the Area
Average Home Value in this Area
Purchase History
| Date | Buyer | Sale Price | Title Company |
|---|---|---|---|
| We Design & Build Llc | $31,000 | None Listed On Document | |
| We Design & Build Llc | $31,000 | None Listed On Document | |
| Cuan Sebastian | -- | None Available | |
| United States Secretary Of Housing And U | $19,503 | None Available | |
| Parker Deborah Lee | -- | None Available |
Source: Public Records
Mortgage History
| Date | Status | Borrower | Loan Amount |
|---|---|---|---|
| Open | We Design & Build Llc | $61,500 | |
| Closed | We Design & Build Llc | $61,500 |
Source: Public Records
Tax History Compared to Growth
Tax History
| Year | Tax Paid | Tax Assessment Tax Assessment Total Assessment is a certain percentage of the fair market value that is determined by local assessors to be the total taxable value of land and additions on the property. | Land | Improvement |
|---|---|---|---|---|
| 2025 | $1,373 | $22,300 | $0 | $0 |
| 2024 | $1,373 | $17,000 | $0 | $0 |
| 2023 | $1,333 | $14,200 | $0 | $0 |
| 2022 | $1,047 | $12,000 | $0 | $0 |
| 2021 | $1,020 | $10,200 | $0 | $0 |
| 2020 | $1,020 | $9,400 | $0 | $0 |
| 2019 | $1,005 | $9,300 | $0 | $0 |
| 2018 | $990 | $9,300 | $0 | $0 |
| 2017 | $157 | $9,500 | $0 | $0 |
| 2016 | $920 | $61,700 | $0 | $0 |
| 2015 | $960 | $9,600 | $0 | $0 |
| 2013 | $1,131 | $13,419 | $0 | $0 |
| 2010 | -- | $19,226 | $362 | $18,864 |
Source: Public Records
Map
Nearby Homes
- 13614 Meyers Rd
- 13637 Manor St
- 13974 Meyers Rd
- 13988 Meyers Rd
- 13919 Manor St
- 13531 Manor St
- 13558 Pinehurst St
- 114215 Sorrento Ave
- 13660 Mendota St
- 13635 Birwood St
- 14169 Monte Vista St
- 14000 Mendota St
- 14187 Appoline St
- 13600 Birwood St
- 14122 Mendota St
- 13101 Steel St
- 13611 Griggs St
- 13560 Griggs St
- 12738 Manor St
- 12875 Steel St
- 13628 Meyers Rd
- 13620 Meyers Rd
- 13629 Manor St
- 13654 Meyers Rd
- 13643 Manor St
- 13608 Meyers Rd
- 13617 Manor St
- 13655 Manor St
- 13663 Manor St
- 13600 Meyers Rd
- 13635 Meyers Rd
- 13621 Meyers Rd
- 13601 Manor St
- 13592 Meyers Rd
- 13607 Meyers Rd
- 13900 Meyers Rd
- 13597 Manor St
- 13591 Manor St
- 13615 Meyers Rd
- 10820 Schoolcraft St