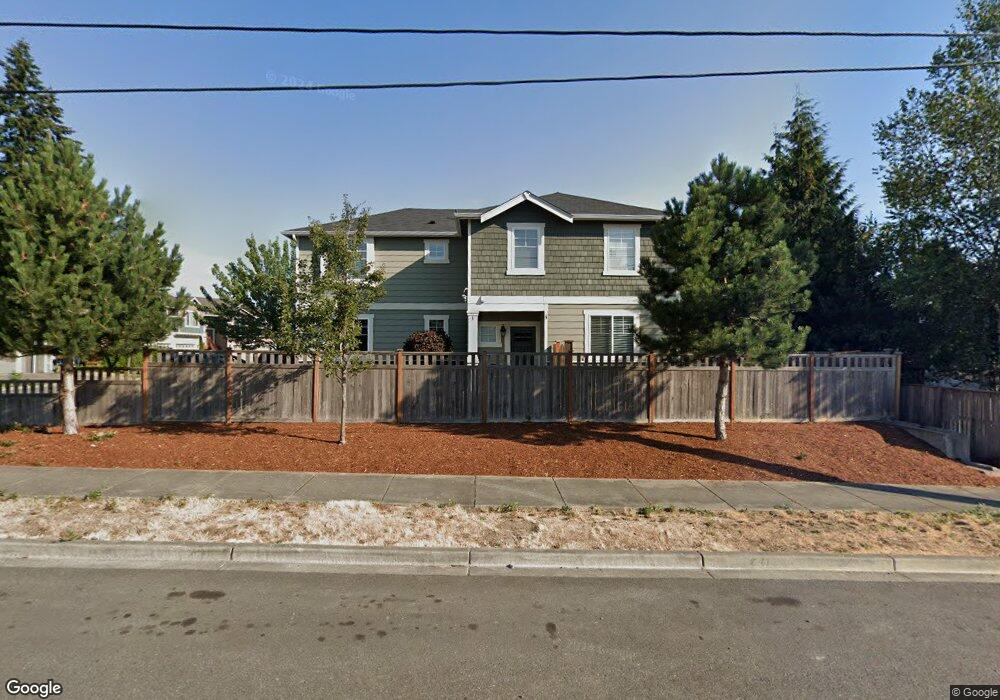
13633 9th Place W Unit 12 Everett, WA 98204
Estimated Value: $687,119 - $716,000
3
Beds
3
Baths
1,773
Sq Ft
$399/Sq Ft
Est. Value
About This Home
This home is located at 13633 9th Place W Unit 12, Everett, WA 98204 and is currently estimated at $707,030, approximately $398 per square foot. 13633 9th Place W Unit 12 is a home located in Snohomish County with nearby schools including Lake Stickney Elementary School, Voyager Middle School, and Mariner High School.
Ownership History
Date
Name
Owned For
Owner Type
Purchase Details
Closed on
Aug 31, 2020
Sold by
Yos Chantharith and Soth Keopesey
Bought by
Chan Bopha and Chan Henry
Current Estimated Value
Home Financials for this Owner
Home Financials are based on the most recent Mortgage that was taken out on this home.
Original Mortgage
$360,000
Outstanding Balance
$256,901
Interest Rate
2.9%
Mortgage Type
New Conventional
Estimated Equity
$450,129
Purchase Details
Closed on
Oct 11, 2011
Sold by
Union Bank Na
Bought by
Yos Chantharith and Soth Keopesey
Home Financials for this Owner
Home Financials are based on the most recent Mortgage that was taken out on this home.
Original Mortgage
$252,434
Interest Rate
4.4%
Mortgage Type
FHA
Purchase Details
Closed on
Jul 22, 2011
Sold by
Oco Ems Llc
Bought by
Union Bank Na
Create a Home Valuation Report for This Property
The Home Valuation Report is an in-depth analysis detailing your home's value as well as a comparison with similar homes in the area
Home Values in the Area
Average Home Value in this Area
Purchase History
| Date | Buyer | Sale Price | Title Company |
|---|---|---|---|
| Chan Bopha | $480,000 | Chicago Title | |
| Yos Chantharith | $259,000 | First American | |
| Union Bank Na | $504,990 | None Available |
Source: Public Records
Mortgage History
| Date | Status | Borrower | Loan Amount |
|---|---|---|---|
| Open | Chan Bopha | $360,000 | |
| Previous Owner | Yos Chantharith | $252,434 |
Source: Public Records
Tax History Compared to Growth
Tax History
| Year | Tax Paid | Tax Assessment Tax Assessment Total Assessment is a certain percentage of the fair market value that is determined by local assessors to be the total taxable value of land and additions on the property. | Land | Improvement |
|---|---|---|---|---|
| 2025 | $5,540 | $627,100 | $378,300 | $248,800 |
| 2024 | $5,540 | $655,400 | $349,800 | $305,600 |
| 2023 | $5,423 | $670,000 | $365,100 | $304,900 |
| 2022 | $4,683 | $487,900 | $229,100 | $258,800 |
| 2020 | $4,413 | $449,000 | $230,000 | $219,000 |
| 2019 | $4,030 | $411,100 | $194,100 | $217,000 |
| 2018 | $3,886 | $345,300 | $149,600 | $195,700 |
| 2017 | $3,718 | $338,500 | $141,900 | $196,600 |
| 2016 | $3,590 | $324,800 | $112,000 | $212,800 |
Source: Public Records
Map
Nearby Homes
- 13710 Ash Way Unit B4
- 13724 Ash Way Unit F-3
- 1028 135th St SW Unit 29
- 1307 141st Place SW
- 927 132nd St SW Unit H5
- 927 132nd St SW Unit D3
- 13411 Meadow Rd
- 13007 E Gibson Rd Unit U238
- 1720 S Lake Stickney Dr
- 1109 146th St SW Unit 6
- 14424 Madison Way Unit C3
- 14424 Madison Way Unit E1
- 14424 Madison Way Unit G5
- 14424 Madison Way Unit E2
- 14424 Madison Way Unit G1
- 14424 Madison Way Unit C4
- 14424 Madison Way Unit E3
- 13417 Meridian Place W
- 12827 14th Ave W Unit 11
- 14504 17th Ave W
- 13629 9th Place W Unit 11
- 13629 9th Place W Unit 112
- 812 135th St SW
- 13632 9th Place W Unit 1
- 13632 9th Place W Unit 112
- 13613 9th Place W
- 13628 9th Place W Unit 2
- 13705 9th Ave W
- 13624 9th Place W Unit 112
- 13624 9th Place W Unit 3
- 906 137th St SW
- 13707 9th Ave W
- 13620 9th Place W
- 13620 9th Place W Unit 4
- 910 137th St SW
- 828 137th St SW
- 1828 137 and Half Th St SW
- 13711 9th Ave W
- 13610 9th Place W
- 13614 9th Place W