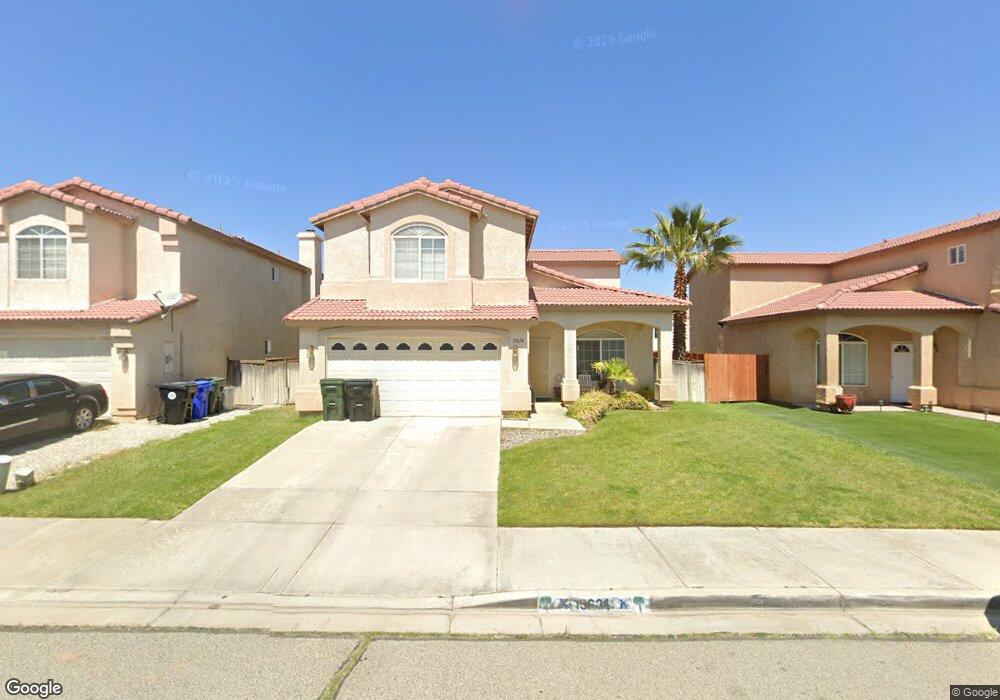
13634 Glenhaven Way Victorville, CA 92392
Mesa Linda NeighborhoodEstimated Value: $417,000 - $454,000
4
Beds
3
Baths
2,031
Sq Ft
$214/Sq Ft
Est. Value
About This Home
This home is located at 13634 Glenhaven Way, Victorville, CA 92392 and is currently estimated at $434,407, approximately $213 per square foot. 13634 Glenhaven Way is a home located in San Bernardino County with nearby schools including Liberty Elementary School, Park View Elementary School, and Imogene Garner Hook Junior High School.
Ownership History
Date
Name
Owned For
Owner Type
Purchase Details
Closed on
Jun 20, 2008
Sold by
Us Bank Na
Bought by
Burnett John S
Current Estimated Value
Home Financials for this Owner
Home Financials are based on the most recent Mortgage that was taken out on this home.
Original Mortgage
$143,100
Outstanding Balance
$91,545
Interest Rate
5.99%
Mortgage Type
Purchase Money Mortgage
Estimated Equity
$342,862
Purchase Details
Closed on
Apr 1, 2008
Sold by
Finch Dmario W and Finch Kimberly A
Bought by
Us Bank Na and Asset Backed Pass Through Certificates S
Purchase Details
Closed on
Dec 24, 2001
Sold by
Chen Hai and Chen Won Chin Chei
Bought by
Finch Dmario W and Finch Kimberly A
Home Financials for this Owner
Home Financials are based on the most recent Mortgage that was taken out on this home.
Original Mortgage
$141,775
Interest Rate
6.51%
Mortgage Type
FHA
Create a Home Valuation Report for This Property
The Home Valuation Report is an in-depth analysis detailing your home's value as well as a comparison with similar homes in the area
Home Values in the Area
Average Home Value in this Area
Purchase History
| Date | Buyer | Sale Price | Title Company |
|---|---|---|---|
| Burnett John S | $159,000 | North American Title Company | |
| Us Bank Na | -- | North American Title Company | |
| Us Bank Na | $164,250 | North American Title Company | |
| Finch Dmario W | $144,000 | Fidelity National Title Co |
Source: Public Records
Mortgage History
| Date | Status | Borrower | Loan Amount |
|---|---|---|---|
| Open | Burnett John S | $143,100 | |
| Previous Owner | Finch Dmario W | $141,775 |
Source: Public Records
Tax History Compared to Growth
Tax History
| Year | Tax Paid | Tax Assessment Tax Assessment Total Assessment is a certain percentage of the fair market value that is determined by local assessors to be the total taxable value of land and additions on the property. | Land | Improvement |
|---|---|---|---|---|
| 2025 | $2,460 | $208,851 | $52,541 | $156,310 |
| 2024 | $2,460 | $204,756 | $51,511 | $153,245 |
| 2023 | $2,436 | $200,741 | $50,501 | $150,240 |
| 2022 | $2,396 | $196,805 | $49,511 | $147,294 |
| 2021 | $2,354 | $192,946 | $48,540 | $144,406 |
| 2020 | $2,312 | $190,967 | $48,042 | $142,925 |
| 2019 | $2,275 | $187,223 | $47,100 | $140,123 |
| 2018 | $2,425 | $183,551 | $46,176 | $137,375 |
| 2017 | $2,376 | $179,952 | $45,271 | $134,681 |
| 2016 | $2,329 | $176,423 | $44,383 | $132,040 |
| 2015 | $2,248 | $173,773 | $43,716 | $130,057 |
| 2014 | $1,741 | $133,500 | $33,600 | $99,900 |
Source: Public Records
Map
Nearby Homes
- 13675 Riverstone Dr
- 13637 Sandstone Dr
- 12228 Cobblestone Dr
- 12396 Emeraldstone Dr
- 13765 Arthur Dr
- 12326 Goldstone Cir
- 13772 Helena Ave
- 12404 Emeraldstone Dr
- 12437 Driftstone Dr
- 12268 Pluto Dr
- 12432 Emeraldstone Dr
- 12170 Pluto Dr
- 13745 Gemini St
- 12446 Mount Baldy Dr
- 12452 Mount Baldy Dr
- 13590 Mica Ave
- 13400 Solitude Cir
- 12404 Mammoth Dr
- 12545 Ironstone Ct
- 0 Ranch Rd Unit HD22190247
- 13642 Glenhaven Way
- 13628 Glenhaven Way
- 13633 Glengarry Dr
- 13641 Glengarry Dr
- 13627 Glengarry Dr
- 13650 Glenhaven Way
- 13649 Glengarry Dr
- 13633 Glenhaven Way
- 13658 Glenhaven Way
- 13641 Glenhaven Way
- 13627 Glenhaven Way
- 13657 Glengarry Dr
- 13649 Glenhaven Way
- 12256 Glenoaks Ln
- 13668 Glenhaven Way Unit 92395
- 13668 Glenhaven Way
- 12238 Glenoaks Ln
- 13657 Glenhaven Way
- 12266 Glenoaks Ln
- 13665 Glengarry Dr