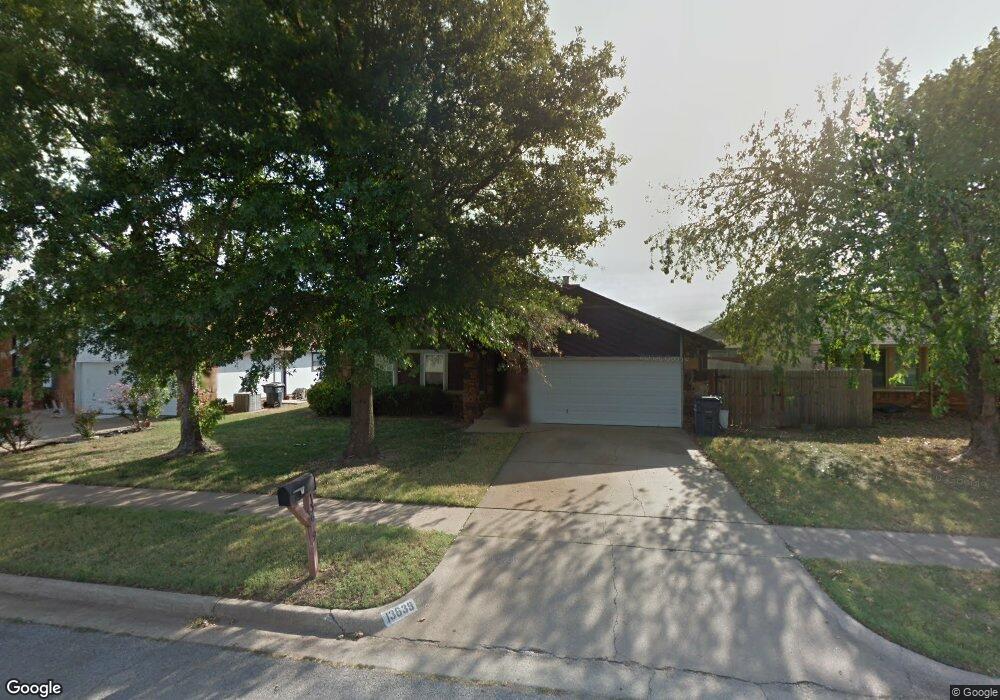
13639 S Maple St Glenpool, OK 74033
Estimated Value: $199,000 - $222,000
3
Beds
2
Baths
1,331
Sq Ft
$160/Sq Ft
Est. Value
About This Home
This home is located at 13639 S Maple St, Glenpool, OK 74033 and is currently estimated at $212,654, approximately $159 per square foot. 13639 S Maple St is a home located in Tulsa County with nearby schools including Glenpool Elementary School, Glenpool Middle School, and Glenpool High School.
Ownership History
Date
Name
Owned For
Owner Type
Purchase Details
Closed on
Oct 9, 2020
Sold by
Fissel James Bryan and Fissel Stacy Ann
Bought by
Fissel James Bryan and Fissel Stacy Ann
Current Estimated Value
Home Financials for this Owner
Home Financials are based on the most recent Mortgage that was taken out on this home.
Original Mortgage
$106,400
Outstanding Balance
$52,860
Interest Rate
2.6%
Mortgage Type
New Conventional
Estimated Equity
$159,794
Purchase Details
Closed on
Dec 26, 2008
Sold by
Fissel James Bryan and Fissel Stacy Ann
Bought by
Fissel James Bryan and Fissel Stacy Ann
Purchase Details
Closed on
Aug 25, 2004
Sold by
Nelson Sally C
Bought by
Fissel James Bryan
Purchase Details
Closed on
Oct 1, 1992
Purchase Details
Closed on
Nov 1, 1990
Create a Home Valuation Report for This Property
The Home Valuation Report is an in-depth analysis detailing your home's value as well as a comparison with similar homes in the area
Home Values in the Area
Average Home Value in this Area
Purchase History
| Date | Buyer | Sale Price | Title Company |
|---|---|---|---|
| Fissel James Bryan | -- | None Available | |
| Fissel James Bryan | -- | Tulsa Abstract & Title Co | |
| Fissel James Bryan | $88,000 | -- | |
| -- | $62,500 | -- | |
| -- | $59,000 | -- |
Source: Public Records
Mortgage History
| Date | Status | Borrower | Loan Amount |
|---|---|---|---|
| Open | Fissel James Bryan | $106,400 |
Source: Public Records
Tax History
| Year | Tax Paid | Tax Assessment Tax Assessment Total Assessment is a certain percentage of the fair market value that is determined by local assessors to be the total taxable value of land and additions on the property. | Land | Improvement |
|---|---|---|---|---|
| 2025 | $1,408 | $11,744 | $1,305 | $10,439 |
| 2024 | $1,289 | $11,374 | $1,318 | $10,056 |
| 2023 | $1,289 | $12,013 | $1,545 | $10,468 |
| 2022 | $1,229 | $10,664 | $1,822 | $8,842 |
| 2021 | $1,208 | $10,324 | $1,764 | $8,560 |
| 2020 | $1,178 | $9,994 | $1,707 | $8,287 |
| 2019 | $1,148 | $9,674 | $1,653 | $8,021 |
| 2018 | $1,107 | $9,363 | $1,600 | $7,763 |
| 2017 | $1,048 | $10,061 | $1,719 | $8,342 |
| 2016 | $1,024 | $9,768 | $2,134 | $7,634 |
| 2015 | $1,019 | $9,768 | $2,134 | $7,634 |
| 2014 | $1,024 | $9,768 | $2,134 | $7,634 |
Source: Public Records
Map
Nearby Homes
- 13674 S Maple St
- 1104 E 137th St
- 1024 E 135th Place
- 13796 S Nyssa Place
- 1211 E 135th St
- 13761 S Nyssa Ct
- 1221 E 134th St
- 13503 S Oak Ct
- 13773 S Oak Place
- 1171 E 133rd St
- 1671 E 140th St
- 13324 S Poplar St
- 243 E 141st St
- 661 E 133rd Place
- 1664 E 138th St S
- 2355 E 135th Place
- 582 E 133rd Place
- 1543 E 137th Place
- 13826 S Elm St
- 501 E 141st Place
- 13651 S Maple St
- 13627 S Maple St
- 13640 S Maple Place
- 13652 S Maple Place
- 13663 S Maple St
- 13628 S Maple Place
- 13638 S Maple St
- 13664 S Maple Place
- 1012 E 135th Place
- 1008 E 135th Place
- 13628 S Maple St
- 13650 S Maple St
- 13675 S Maple St
- 1016 E 135th Place
- 1004 E 135th Place
- 13676 S Maple Place
- 13662 S Maple St
- 13685 S Maple St
- 1020 E 135th Place
- 1000 E 135th Place
Your Personal Tour Guide
Ask me questions while you tour the home.