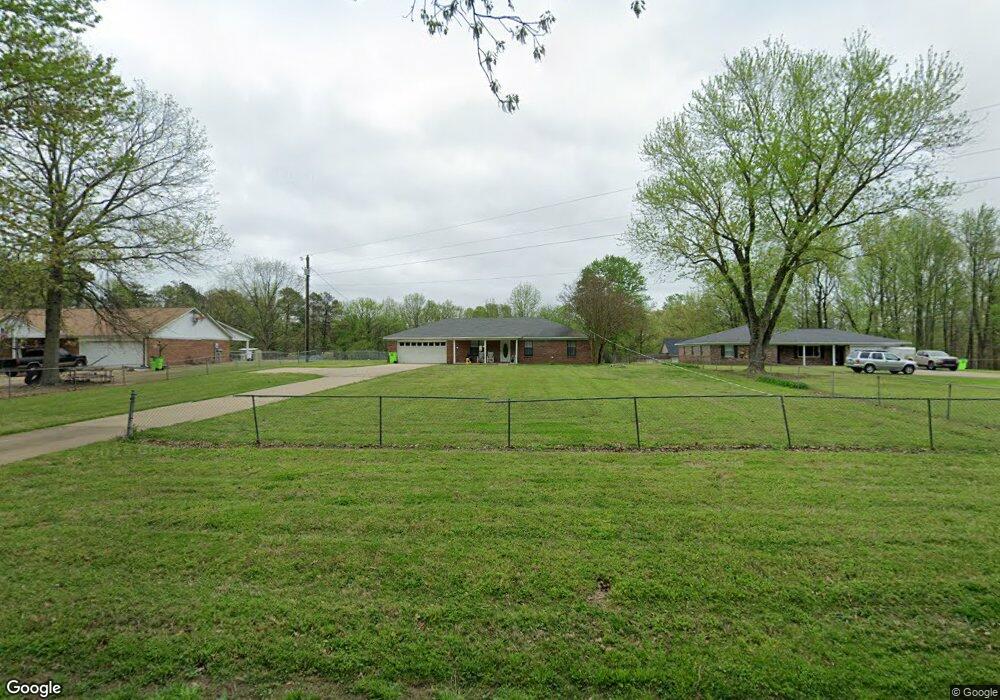
1364 Monasco Rd Millington, TN 38053
Estimated Value: $209,822 - $286,000
--
Bed
2
Baths
1,523
Sq Ft
$166/Sq Ft
Est. Value
About This Home
This home is located at 1364 Monasco Rd, Millington, TN 38053 and is currently estimated at $253,206, approximately $166 per square foot. 1364 Monasco Rd is a home located in Tipton County with nearby schools including Drummonds Elementary School, Munford Middle School, and Munford High School.
Ownership History
Date
Name
Owned For
Owner Type
Purchase Details
Closed on
Jun 25, 2007
Sold by
Nylin Sharon K
Bought by
Smith Mark W
Current Estimated Value
Home Financials for this Owner
Home Financials are based on the most recent Mortgage that was taken out on this home.
Original Mortgage
$129,000
Outstanding Balance
$79,616
Interest Rate
6.35%
Estimated Equity
$173,590
Purchase Details
Closed on
Aug 8, 2005
Sold by
Falconer Shon D
Bought by
Nylin Sharon K
Purchase Details
Closed on
Sep 29, 2004
Sold by
Schwanbeck Carl J
Bought by
Falconer Shon D
Home Financials for this Owner
Home Financials are based on the most recent Mortgage that was taken out on this home.
Original Mortgage
$118,000
Interest Rate
5.75%
Purchase Details
Closed on
Dec 18, 1995
Sold by
Va
Bought by
Jan Schwanbeck Carl
Purchase Details
Closed on
Jun 5, 1995
Bought by
Secretary Of Veterans Affairs
Purchase Details
Closed on
Apr 24, 1992
Bought by
Lockridge Karrie M Etvir Joe D
Create a Home Valuation Report for This Property
The Home Valuation Report is an in-depth analysis detailing your home's value as well as a comparison with similar homes in the area
Home Values in the Area
Average Home Value in this Area
Purchase History
| Date | Buyer | Sale Price | Title Company |
|---|---|---|---|
| Smith Mark W | $129,000 | -- | |
| Nylin Sharon K | $117,741 | -- | |
| Falconer Shon D | $118,000 | -- | |
| Jan Schwanbeck Carl | $88,500 | -- | |
| Secretary Of Veterans Affairs | -- | -- | |
| Lockridge Karrie M Etvir Joe D | -- | -- |
Source: Public Records
Mortgage History
| Date | Status | Borrower | Loan Amount |
|---|---|---|---|
| Open | Lockridge Karrie M Etvir Joe D | $129,000 | |
| Previous Owner | Lockridge Karrie M Etvir Joe D | $118,000 |
Source: Public Records
Tax History Compared to Growth
Tax History
| Year | Tax Paid | Tax Assessment Tax Assessment Total Assessment is a certain percentage of the fair market value that is determined by local assessors to be the total taxable value of land and additions on the property. | Land | Improvement |
|---|---|---|---|---|
| 2024 | $861 | $56,550 | $8,000 | $48,550 |
| 2023 | $861 | $56,550 | $8,000 | $48,550 |
| 2022 | $808 | $39,600 | $5,875 | $33,725 |
| 2021 | $808 | $39,600 | $5,875 | $33,725 |
| 2020 | $808 | $39,600 | $5,875 | $33,725 |
| 2019 | $767 | $31,675 | $5,375 | $26,300 |
| 2018 | $767 | $31,675 | $5,375 | $26,300 |
| 2017 | $767 | $31,675 | $5,375 | $26,300 |
| 2016 | $767 | $31,675 | $5,375 | $26,300 |
| 2015 | $766 | $31,675 | $5,375 | $26,300 |
| 2014 | $766 | $31,681 | $0 | $0 |
Source: Public Records
Map
Nearby Homes
- 79 Marshall Cove
- 9590 Monasco Rd
- 9640 New Bethel Rd
- 9430 Monasco Rd
- 0 Herring Hill Rd
- 8925 Herring Hill Rd
- 1476 Crigger Rd
- 979 Ray Bluff Rd
- 1932 Saint Paul Rd
- 0 St Paul Rd Unit 10199051
- 0 Ray Bluff Rd
- 0 Dixon Rd
- 8292 Rankin Branch Rd
- 3300 Cuba Millington Rd
- TRACT 9 Powder Plant Dr
- 0 Chambers Rd
- 400 Whippoorwill Cir
- 2078 Russell Bond Rd
- 8159 Epperson Mill Rd
- 138 Gayden Dr
- 1344 Monasco Rd
- 1390 Monasco Rd
- 1418 Monasco Rd
- 1328 Monasco Rd
- 1296 Monasco Rd
- 1442 Monasco Rd
- 1460 Monasco Rd
- 1433 Monasco Rd
- 1434 Monasco Rd
- 1432 Monasco Rd
- 1493 Monasco Rd
- 1437 Monasco Rd
- 1492 Monasco Rd
- 1174 Monasco Rd
- 1174 Monasco Rd
- 1223 Monasco Rd
- 9770 Monasco Rd
- 9793 New Bethel Rd
- 193 Pannell Dr
- 9760 Monasco Rd