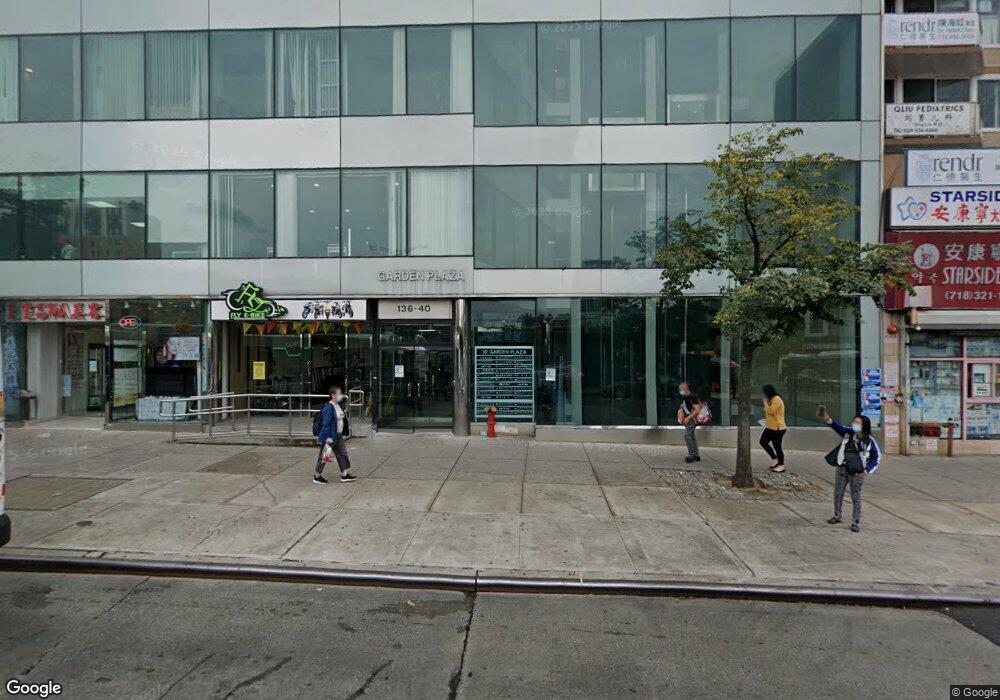
13640 39th Ave Unit D3 Flushing, NY 11354
Flushing-Willets Point NeighborhoodEstimated Value: $868,777
Studio
--
Bath
660
Sq Ft
$1,316/Sq Ft
Est. Value
About This Home
This home is located at 13640 39th Ave Unit D3, Flushing, NY 11354 and is currently estimated at $868,777, approximately $1,316 per square foot. 13640 39th Ave Unit D3 is a home located in Queens County with nearby schools including P.S. 209 - Clearview Gardens, I.S. 25 Adrien Block, and Flushing High School.
Ownership History
Date
Name
Owned For
Owner Type
Purchase Details
Closed on
Aug 15, 2024
Sold by
Jjsk 303 Llc
Bought by
Hu & Associates Immigrant Svc Inc
Current Estimated Value
Purchase Details
Closed on
May 7, 2018
Sold by
Idouchi John K and Kim-Idouchi Justine B
Bought by
Jjsk 303 Llc
Purchase Details
Closed on
Jun 29, 2007
Sold by
Wu Lian Huo
Bought by
Idouchi John K and Idouchi Justine B
Home Financials for this Owner
Home Financials are based on the most recent Mortgage that was taken out on this home.
Original Mortgage
$294,000
Interest Rate
6.48%
Mortgage Type
Commercial
Create a Home Valuation Report for This Property
The Home Valuation Report is an in-depth analysis detailing your home's value as well as a comparison with similar homes in the area
Home Values in the Area
Average Home Value in this Area
Purchase History
| Date | Buyer | Sale Price | Title Company |
|---|---|---|---|
| Hu & Associates Immigrant Svc Inc | $830,000 | -- | |
| Hu & Associates Immigrant Svc Inc | $830,000 | -- | |
| Jjsk 303 Llc | $810,000 | -- | |
| Jjsk 303 Llc | $810,000 | -- | |
| Jjsk 303 Llc | $810,000 | -- | |
| Idouchi John K | $420,000 | -- | |
| Idouchi John K | $420,000 | -- |
Source: Public Records
Mortgage History
| Date | Status | Borrower | Loan Amount |
|---|---|---|---|
| Previous Owner | Idouchi John K | $294,000 |
Source: Public Records
Tax History
| Year | Tax Paid | Tax Assessment Tax Assessment Total Assessment is a certain percentage of the fair market value that is determined by local assessors to be the total taxable value of land and additions on the property. | Land | Improvement |
|---|---|---|---|---|
| 2025 | $12,825 | $122,655 | $15,509 | $107,146 |
| 2024 | $12,825 | $121,086 | $15,509 | $105,577 |
| 2023 | $12,821 | $121,043 | $15,509 | $105,534 |
| 2022 | $12,880 | $121,292 | $15,509 | $105,783 |
| 2021 | $10,226 | $95,624 | $15,509 | $80,115 |
| 2020 | $11,902 | $122,825 | $15,509 | $107,316 |
| 2019 | $11,344 | $120,075 | $15,509 | $104,566 |
| 2018 | $10,898 | $103,653 | $15,509 | $88,144 |
| 2017 | $10,581 | $100,635 | $15,510 | $85,125 |
| 2016 | $10,032 | $100,635 | $15,510 | $85,125 |
| 2015 | $4,841 | $88,119 | $14,962 | $73,157 |
| 2014 | $4,841 | $81,103 | $14,692 | $66,411 |
Source: Public Records
Map
Nearby Homes
- 13835 39th Ave Unit 17M
- 13835 39th Ave Unit 12L
- 13835 39th Ave Unit 12F
- 136-39 41st Ave Unit 5
- 136-46 41st Ave Unit 6A
- 13646 41st Ave Unit 2A
- 142-05 Roosevelt Ave Unit 415
- 142-05 Roosevelt Ave Unit 721
- 142-05 Roosevelt Ave Unit 328
- 142-05 Roosevelt Ave Unit 539
- 142-05 Roosevelt Ave Unit 602
- 142-05 Roosevelt Ave Unit 507
- 142-05 Roosevelt Ave Unit 517
- 142-05 Roosevelt Ave Unit 301
- 142-05 Roosevelt Ave Unit 521
- 41-25 Kissena Blvd Unit 6Hh
- 136-75 37th Ave Unit 10H
- 136-80 41st Ave Unit 7H
- 136-80 41st Ave Unit 6B
- 136-80 41st Ave Unit 7B
- 13640 39th Ave Unit D3
- 13640 39th Ave
- 13640 39th Ave Unit 204
- 13640 39th Ave Unit 1B
- 13640 39th Ave Unit 6A Rm5
- 13640 39th Ave Unit 6A Mez
- 13640 39th Ave Unit 6A Rm4
- 13640 39th Ave Unit 6A Rm3
- 13640 39th Ave Unit 6A Rm2
- 13640 39th Ave Unit 6A Rm1
- 13640 39th Ave Unit 6A
- 13640 39th Ave Unit B-2
- 13640 39th Ave Unit 602
- 13640 39th Ave Unit 302
- 13640 39th Ave Unit 507
- 13640 39th Ave Unit 303&4
- 13640 39th Ave
- 13640 39th Ave Unit 1
- 13640 39th Ave Unit 6th Fl
- 13640 39th Ave Unit 302
Your Personal Tour Guide
Ask me questions while you tour the home.