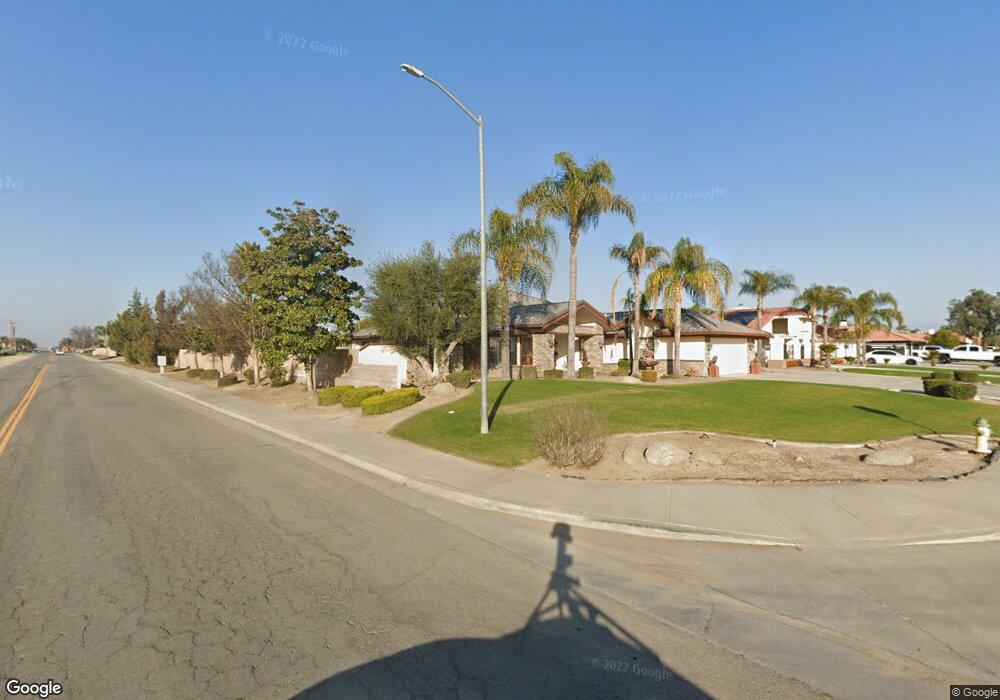
13640 Spring Mountain Ave Bakersfield, CA 93314
Estimated Value: $617,032 - $675,000
4
Beds
2
Baths
2,631
Sq Ft
$246/Sq Ft
Est. Value
About This Home
This home is located at 13640 Spring Mountain Ave, Bakersfield, CA 93314 and is currently estimated at $646,258, approximately $245 per square foot. 13640 Spring Mountain Ave is a home located in Kern County with nearby schools including Independence Elementary School, Freedom Middle School, and Frontier High School.
Ownership History
Date
Name
Owned For
Owner Type
Purchase Details
Closed on
Jun 10, 2011
Sold by
Kilgore Opal J
Bought by
Kilgore Opal J and Opal J Kilgore Trust
Current Estimated Value
Purchase Details
Closed on
Nov 5, 2001
Sold by
Kilgore Opal J T and Kilgore Booker T
Bought by
Kilgore Opal J
Home Financials for this Owner
Home Financials are based on the most recent Mortgage that was taken out on this home.
Original Mortgage
$199,750
Interest Rate
6.73%
Purchase Details
Closed on
Nov 20, 1997
Sold by
Jean Kilgore Booker and Jean Opal
Bought by
Livi Booker T and Livi Opal J Kilgore Revocable
Purchase Details
Closed on
Mar 25, 1997
Sold by
Kilgore Booker and Kilgore Opal Jean
Bought by
Kilgore Booker T and Kilgore Opal J
Home Financials for this Owner
Home Financials are based on the most recent Mortgage that was taken out on this home.
Original Mortgage
$211,000
Interest Rate
7.63%
Create a Home Valuation Report for This Property
The Home Valuation Report is an in-depth analysis detailing your home's value as well as a comparison with similar homes in the area
Home Values in the Area
Average Home Value in this Area
Purchase History
| Date | Buyer | Sale Price | Title Company |
|---|---|---|---|
| Kilgore Opal J | -- | None Available | |
| Kilgore Opal J | -- | American Title Co | |
| Livi Booker T | -- | -- | |
| Kilgore Booker T | -- | Fidelity National Title Co |
Source: Public Records
Mortgage History
| Date | Status | Borrower | Loan Amount |
|---|---|---|---|
| Closed | Kilgore Opal J | $199,750 | |
| Closed | Kilgore Booker T | $211,000 |
Source: Public Records
Tax History Compared to Growth
Tax History
| Year | Tax Paid | Tax Assessment Tax Assessment Total Assessment is a certain percentage of the fair market value that is determined by local assessors to be the total taxable value of land and additions on the property. | Land | Improvement |
|---|---|---|---|---|
| 2025 | $4,624 | $366,374 | $88,399 | $277,975 |
| 2024 | $4,511 | $359,191 | $86,666 | $272,525 |
| 2023 | $4,511 | $352,149 | $84,967 | $267,182 |
| 2022 | $4,408 | $345,245 | $83,301 | $261,944 |
| 2021 | $4,283 | $338,476 | $81,668 | $256,808 |
| 2020 | $4,207 | $335,006 | $80,831 | $254,175 |
| 2019 | $4,133 | $335,006 | $80,831 | $254,175 |
| 2018 | $4,023 | $322,000 | $77,694 | $244,306 |
| 2017 | $3,954 | $315,687 | $76,171 | $239,516 |
| 2016 | $3,665 | $309,498 | $74,678 | $234,820 |
| 2015 | $3,613 | $304,850 | $73,557 | $231,293 |
| 2014 | $3,541 | $298,880 | $72,117 | $226,763 |
Source: Public Records
Map
Nearby Homes
- 13602 Philip Phelps Ave
- 13507 Velma Pearl Way
- 3849 Jenkins Rd
- 13615 Velma Pearl Way
- 3611 Jenkins Rd
- 13946 Santa fe Ct
- 14014 Santa fe Ct
- 13303 Ascot Ct
- 3616 Three Bars St
- 14012 Cedar Creek Ave
- 3408 Shauna Marie St
- 0 Rosedale Unit 202511650
- 3000 Allen Rd
- 2639 Jenkins Rd
- 13754 Rosedale Hwy
- 14631 Blue Stream Ave
- 14508 Plumeria Ct
- 12912 Tyler Ct
- 13013 Tyler Ct
- 2612 Van Buren Place
- 13620 Spring Mountain Ave
- 13641 Powder River Ave
- 13621 Powder River Ave
- 13600 Spring Mountain Ave
- 13621 Spring Mountain Ave
- 3919 Jenkins Rd
- 13540 Spring Mountain Ave
- 13601 Spring Mountain Ave
- 13541 Powder River Ave
- 13541 Spring Mountain Ave
- 13640 Powder River Ave
- 13520 Spring Mountain Ave
- 13620 Powder River Ave
- 4001 Jenkins Rd
- 13521 Powder River Ave
- 13600 Powder River Ave
- 13521 Spring Mountain Ave
- 13540 Powder River Ave
- 13500 Spring Mountain Ave
- 13501 Spring Mountain Ave