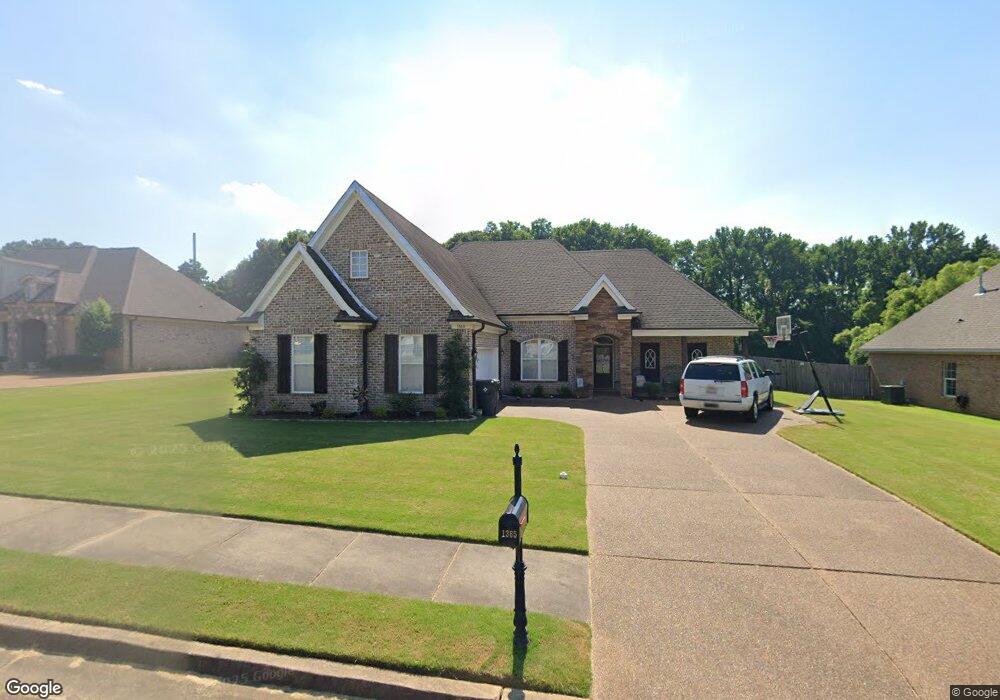
1365 Bending Oak W Hernando, MS 38632
Estimated Value: $315,000 - $404,000
4
Beds
2
Baths
2,467
Sq Ft
$146/Sq Ft
Est. Value
About This Home
This home is located at 1365 Bending Oak W, Hernando, MS 38632 and is currently estimated at $359,198, approximately $145 per square foot. 1365 Bending Oak W is a home located in DeSoto County with nearby schools including Oak Grove Central Elementary School, Hernando Hills Elementary, and Hernando Elementary School.
Ownership History
Date
Name
Owned For
Owner Type
Purchase Details
Closed on
Jan 28, 2019
Sold by
Mills Timothy Paul
Bought by
Mills Cheslea
Current Estimated Value
Purchase Details
Closed on
Sep 30, 2010
Sold by
Kramer Robert P
Bought by
Mills Timothy P and Kramer Cheslea P
Home Financials for this Owner
Home Financials are based on the most recent Mortgage that was taken out on this home.
Original Mortgage
$196,355
Outstanding Balance
$128,509
Interest Rate
4.42%
Mortgage Type
FHA
Estimated Equity
$230,689
Purchase Details
Closed on
Sep 5, 2008
Sold by
Traditional Builders Llc
Bought by
Kramer Robert P
Home Financials for this Owner
Home Financials are based on the most recent Mortgage that was taken out on this home.
Original Mortgage
$169,600
Interest Rate
6.48%
Mortgage Type
Purchase Money Mortgage
Create a Home Valuation Report for This Property
The Home Valuation Report is an in-depth analysis detailing your home's value as well as a comparison with similar homes in the area
Home Values in the Area
Average Home Value in this Area
Purchase History
| Date | Buyer | Sale Price | Title Company |
|---|---|---|---|
| Mills Cheslea | -- | None Available | |
| Mills Timothy P | -- | Realty Title | |
| Kramer Robert P | -- | None Available |
Source: Public Records
Mortgage History
| Date | Status | Borrower | Loan Amount |
|---|---|---|---|
| Open | Mills Timothy P | $196,355 | |
| Closed | Kramer Robert P | $169,600 |
Source: Public Records
Tax History
| Year | Tax Paid | Tax Assessment Tax Assessment Total Assessment is a certain percentage of the fair market value that is determined by local assessors to be the total taxable value of land and additions on the property. | Land | Improvement |
|---|---|---|---|---|
| 2025 | $2,569 | $22,051 | $3,500 | $18,551 |
| 2024 | $2,261 | $16,297 | $3,500 | $12,797 |
| 2023 | $2,261 | $16,297 | $0 | $0 |
| 2022 | $2,261 | $16,297 | $3,500 | $12,797 |
| 2021 | $2,261 | $16,297 | $3,500 | $12,797 |
| 2020 | $2,118 | $15,268 | $3,500 | $11,768 |
| 2019 | $2,118 | $15,268 | $3,500 | $11,768 |
| 2017 | $2,224 | $28,394 | $15,947 | $12,447 |
| 2016 | $2,131 | $15,947 | $3,500 | $12,447 |
| 2015 | $2,131 | $28,394 | $15,947 | $12,447 |
| 2014 | $2,080 | $15,947 | $0 | $0 |
| 2013 | $2,080 | $15,947 | $0 | $0 |
Source: Public Records
Map
Nearby Homes
- 604 Rowan Oak Place
- 1070 Green T Lake W
- 445 Augusta Dr
- 665 Cedar Grove Cove
- 5267 Reserve Way
- 3066 Meadows Way
- 1428 Brayden Ln
- 1254 Creekside Ln
- 833 Martin Cir N
- 208 Elkwood Ln
- 1679 Sandpiper Cove N
- 1567 Eden Loop
- 990 Eagle Ridge Cove
- 925 Cedar Grove Pkwy
- 1123 Tara Dr
- 124 Pebble Creek Cove E
- 120 N Parkway St
- 691 Green T Lake W
- 723 Fairway Trail
- 1268 S Lake Dr
- 1381 Bending Oak W
- 1346 Bending Oak W
- 1345 Bending Oak W
- 1370 Bending Oak W
- 1399 Bending Oak W
- 683 Bending Oak Cove
- 1313 Grove Park Office Dr
- 621 Bending Oak Cir
- 604 Bending Oak Cove
- 1417 Bending Oak W
- 604 Bending Oak Cir
- 595 Bending Oak Cove
- 595 Bending Oak Cir
- 621 Bending Oak Cove
- 1439 Bending Oak W
- 620 Bending Oak Cove
- 574 Bending Oak S
- 4 Grove Park Dr Unit Office
- 3 Grove Park Dr Unit Office
- 2 Grove Park Dr Unit Office
Your Personal Tour Guide
Ask me questions while you tour the home.