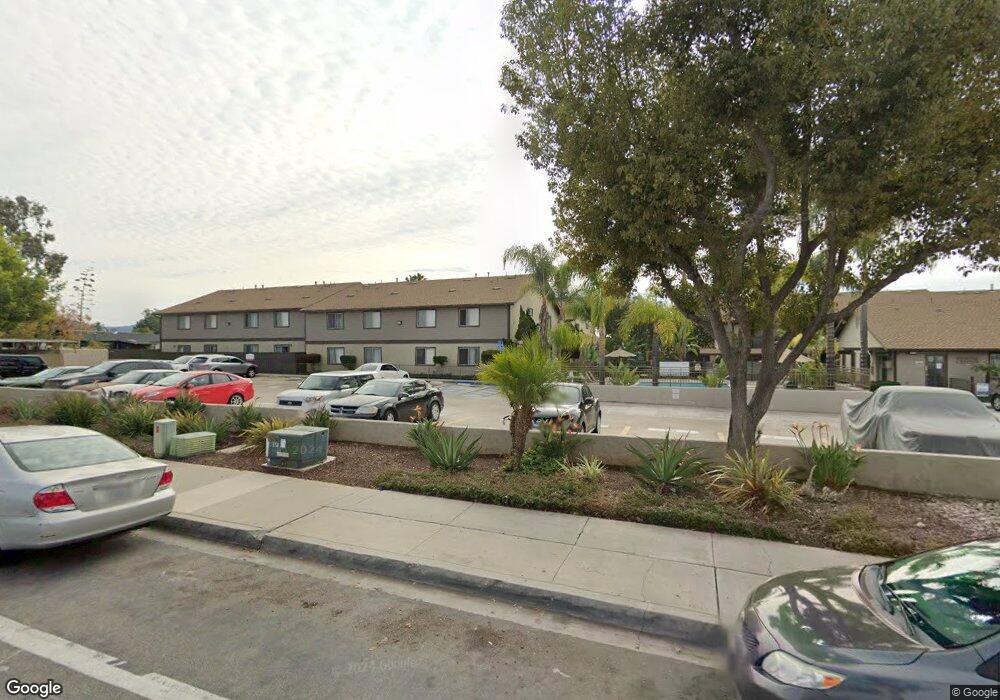
1365 Broadway El Cajon, CA 92021
3
Beds
--
Bath
1,000
Sq Ft
68,389
Sq Ft Lot
About This Home
Welcome to Canyon Run Apartments, located in the heart of El Cajon. You'll love the convenience of having major highways, Gillespie Field, shopping, restaurants and major attractions such as the San Diego Zoo and Sea World just minutes away. At Canyon Run, we offer a three-bedroom floor plan to accommodate all lifestyles. Our apartment homes come fully equipped with standard features such as private balconies and patios, ceiling fans, all-electric gourmet kitchens, air conditioning and in select units, private yards. Enjoy our swimming pool, picnic area with barbecue or take the kids to your playground. We are also a cat-friendly community so bring your feline friend!
Create a Home Valuation Report for This Property
The Home Valuation Report is an in-depth analysis detailing your home's value as well as a comparison with similar homes in the area
Property History
| Date | Event | Price | List to Sale | Price per Sq Ft |
|---|---|---|---|---|
| 07/17/2025 07/17/25 | Off Market | -- | -- | -- |
| 06/07/2025 06/07/25 | For Rent | -- | -- | -- |
| 03/05/2025 03/05/25 | Off Market | -- | -- | -- |
| 02/11/2025 02/11/25 | For Rent | -- | -- | -- |
| 12/21/2024 12/21/24 | Off Market | -- | -- | -- |
| 12/16/2024 12/16/24 | For Rent | -- | -- | -- |
| 12/07/2024 12/07/24 | Off Market | -- | -- | -- |
| 10/29/2024 10/29/24 | For Rent | -- | -- | -- |
| 10/28/2024 10/28/24 | Off Market | -- | -- | -- |
| 10/02/2024 10/02/24 | For Rent | -- | -- | -- |
| 06/07/2022 06/07/22 | For Rent | -- | -- | -- |
| 05/18/2022 05/18/22 | For Rent | -- | -- | -- |
Tax History
| Year | Tax Paid | Tax Assessment Tax Assessment Total Assessment is a certain percentage of the fair market value that is determined by local assessors to be the total taxable value of land and additions on the property. | Land | Improvement |
|---|---|---|---|---|
| 2025 | $206,041 | $14,306,920 | $8,489,664 | $5,817,256 |
| 2024 | $206,041 | $14,027,458 | $8,323,200 | $5,704,258 |
| 2023 | $199,159 | $4,600,167 | $1,879,847 | $2,720,320 |
| 2022 | $87,886 | $4,600,167 | $1,879,847 | $2,720,320 |
| 2021 | $86,988 | $4,502,549 | $1,842,988 | $2,659,561 |
| 2020 | $88,852 | $4,461,241 | $1,824,091 | $2,637,150 |
| 2019 | $53,630 | $4,376,049 | $1,788,325 | $2,587,724 |
| 2018 | $52,792 | $4,292,515 | $1,753,260 | $2,539,255 |
| 2017 | $29,744 | $2,385,423 | $675,398 | $1,710,025 |
| 2016 | $28,508 | $2,334,317 | $662,155 | $1,672,162 |
| 2015 | $28,298 | $2,293,685 | $652,209 | $1,641,476 |
| 2014 | $27,776 | $2,250,404 | $639,434 | $1,610,970 |
Source: Public Records
Map
Nearby Homes
- 1372 Marline Ave
- 1000 Teatro Cir
- 1424 Oakdale Ave
- 1383-87 Oakdale Ave
- 1429 Oakdale Ave
- 514 Shady Ln Unit C
- 540 Oakdale Ln Unit C
- 1244 E Madison Ave Unit C
- 1526 Greenfield Dr
- 1122-24 Oro St
- 1345 E Madison Ave Unit 5
- 1425 E Madison Ave Unit 18
- 1425 E Madison Ave Unit 29
- 648 Trenton St Unit 5
- 389 Shady Ln Unit D
- 1145 Sumner Ave
- 1229 E Madison Ave
- 1369 E Main St Unit 34
- 1369 E Main St Unit 3
- 1369 E Main St Unit 35
- 1357 Broadway
- 1356 Peach Ave Unit A
- 1352 Peach Ave
- 1352 Peach Ave Unit A
- 1350 Peach Ave Unit A
- 1358 Peach Ave Unit 60
- 1351 Broadway
- 1351 1351 Broadway
- 1362 Peach Ave Unit 64
- 1348A Peach Ave Unit B
- 1366 Peach Ave Unit 68
- 1344 Peach Ave Unit A
- 1385 Broadway
- 1370 Peach Ave Unit 74
- 1370 -74 Peach Ave
- 1338 Peach Ave
- 1391 Broadway Unit House B
- 1391 Broadway Unit House A
- 1391 Broadway
- 1391A Broadway Unit D
Your Personal Tour Guide
Ask me questions while you tour the home.