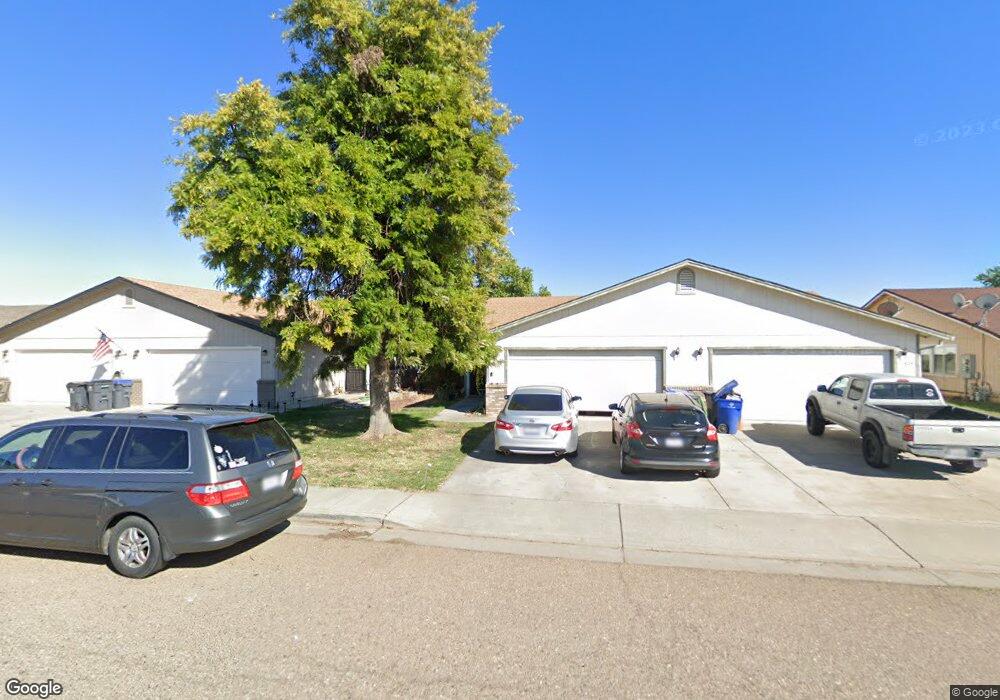
1365 Howard Ct Red Bluff, CA 96080
Estimated Value: $234,000 - $353,000
3
Beds
4
Baths
--
Sq Ft
7,057
Sq Ft
About This Home
This home is located at 1365 Howard Ct, Red Bluff, CA 96080 and is currently estimated at $295,673. 1365 Howard Ct is a home located in Tehama County with nearby schools including William M. Metteer Elementary School, Vista Preparatory Academy, and Red Bluff High School.
Ownership History
Date
Name
Owned For
Owner Type
Purchase Details
Closed on
Oct 8, 2009
Sold by
Aurora Loan Services Llc
Bought by
Disibio Steve
Current Estimated Value
Purchase Details
Closed on
Jul 24, 2009
Sold by
Palmer Eugene D and Palmer Jeanie M
Bought by
Aurora Loan Services Llc
Purchase Details
Closed on
Jan 14, 2009
Sold by
Palmer Eugene D and Palmer Jeanie M
Bought by
Wilshire Holding Group Inc
Purchase Details
Closed on
Jun 3, 2003
Sold by
Collins Brent V
Bought by
Palmer Eugene D and Palmer Jeanie M
Home Financials for this Owner
Home Financials are based on the most recent Mortgage that was taken out on this home.
Original Mortgage
$138,800
Interest Rate
5.61%
Mortgage Type
Unknown
Purchase Details
Closed on
Jun 15, 2001
Sold by
Collins Marsha K
Bought by
Collins Brent V
Create a Home Valuation Report for This Property
The Home Valuation Report is an in-depth analysis detailing your home's value as well as a comparison with similar homes in the area
Purchase History
| Date | Buyer | Sale Price | Title Company |
|---|---|---|---|
| Disibio Steve | $148,000 | Chicago Title Company | |
| Aurora Loan Services Llc | $271,867 | None Available | |
| Wilshire Holding Group Inc | -- | None Available | |
| Palmer Eugene D | $173,500 | Northern California Title Co | |
| Collins Brent V | -- | Northern California Title Co | |
| Collins Brent | -- | Northern California Title Co |
Source: Public Records
Mortgage History
| Date | Status | Borrower | Loan Amount |
|---|---|---|---|
| Previous Owner | Palmer Eugene D | $138,800 |
Source: Public Records
Tax History
| Year | Tax Paid | Tax Assessment Tax Assessment Total Assessment is a certain percentage of the fair market value that is determined by local assessors to be the total taxable value of land and additions on the property. | Land | Improvement |
|---|---|---|---|---|
| 2025 | $1,942 | $191,028 | $51,627 | $139,401 |
| 2023 | $1,909 | $183,612 | $49,623 | $133,989 |
| 2022 | $1,896 | $180,012 | $48,650 | $131,362 |
| 2021 | $1,820 | $176,484 | $47,697 | $128,787 |
| 2020 | $1,858 | $174,675 | $47,208 | $127,467 |
| 2019 | $1,870 | $171,251 | $46,283 | $124,968 |
| 2018 | $1,729 | $167,894 | $45,376 | $122,518 |
| 2017 | $1,744 | $164,603 | $44,487 | $120,116 |
| 2016 | $1,629 | $161,376 | $43,615 | $117,761 |
| 2015 | -- | $158,953 | $42,960 | $115,993 |
| 2014 | $1,581 | $155,840 | $42,119 | $113,721 |
Source: Public Records
Map
Nearby Homes
- 131 Brookridge Dr Unit 1
- 1212 S Jackson St
- 590 Brearcliffe Dr
- 8 Sutter St
- 4 Sutter St
- 660 Villa Dr
- 425 S Jackson St
- 406 S Jackson St
- 845 Olive St
- 224 S Jackson St
- 1210 Wetter Way
- 180 S Main St
- 1160 Orange St
- 1280 Southpointe Dr
- 1235 Britt Ln
- 275 Howell Ave
- 1307 Deborah Dr
- 1455 Acacia St
- 350 Gilmore Rd Unit 16
- 195 Howell Ave
- 1385 Howard Ct
- 1345 Howard Ct
- 1415 Howard Ct
- 1325 Howard Ct
- 1375 Metzger St
- 1340 Howard Ct
- 1330 Howard Ct
- 1320 Howard Ct Unit 1330 Howard Court
- 1435 Howard Ct
- 1400 Howard Ct
- 1315 Howard Ct
- 1305 Howard Ct
- 1325 Metzger St
- 1420 Howard Ct
- 1300 Howard Ct
- 1455 Howard Ct Unit 1465 Howard Court
- 1455 Howard Ct
- 1357 Kirsten Ct
- 1407 Kirsten Ct Unit 1417
- 1337 Kirsten Ct
Your Personal Tour Guide
Ask me questions while you tour the home.