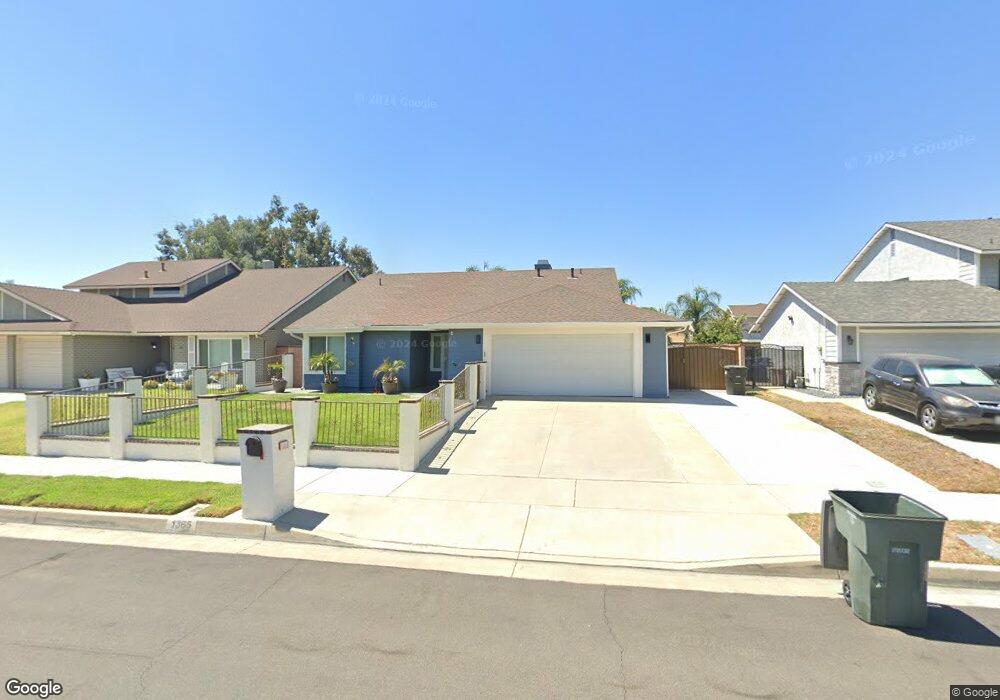
1365 La Mancha Way Ontario, CA 91764
Estimated Value: $665,000 - $716,000
3
Beds
2
Baths
1,448
Sq Ft
$477/Sq Ft
Est. Value
About This Home
This home is located at 1365 La Mancha Way, Ontario, CA 91764 and is currently estimated at $691,301, approximately $477 per square foot. 1365 La Mancha Way is a home located in San Bernardino County with nearby schools including Ontario Center School, Rancho Cucamonga Middle, and Colony High.
Ownership History
Date
Name
Owned For
Owner Type
Purchase Details
Closed on
Jul 25, 2016
Sold by
Jackson Dustin
Bought by
Jackson Dustin
Current Estimated Value
Home Financials for this Owner
Home Financials are based on the most recent Mortgage that was taken out on this home.
Original Mortgage
$253,700
Outstanding Balance
$202,814
Interest Rate
3.54%
Mortgage Type
New Conventional
Estimated Equity
$488,487
Purchase Details
Closed on
Jul 11, 2015
Sold by
Jackson Dustin
Bought by
Jackson Dustin
Home Financials for this Owner
Home Financials are based on the most recent Mortgage that was taken out on this home.
Original Mortgage
$256,000
Interest Rate
4.01%
Mortgage Type
New Conventional
Purchase Details
Closed on
May 14, 1999
Sold by
Oltjenbruns Steven K
Bought by
Jackson Dustin and Jackson Narvolean
Home Financials for this Owner
Home Financials are based on the most recent Mortgage that was taken out on this home.
Original Mortgage
$150,990
Interest Rate
7.01%
Mortgage Type
FHA
Create a Home Valuation Report for This Property
The Home Valuation Report is an in-depth analysis detailing your home's value as well as a comparison with similar homes in the area
Home Values in the Area
Average Home Value in this Area
Purchase History
| Date | Buyer | Sale Price | Title Company |
|---|---|---|---|
| Jackson Dustin | -- | Title365 | |
| Jackson Dustin | $131,500 | Spl Title Services | |
| Jackson Dustin | $152,000 | Fidelity National Title Co |
Source: Public Records
Mortgage History
| Date | Status | Borrower | Loan Amount |
|---|---|---|---|
| Open | Jackson Dustin | $253,700 | |
| Closed | Jackson Dustin | $256,000 | |
| Closed | Jackson Dustin | $150,990 |
Source: Public Records
Tax History Compared to Growth
Tax History
| Year | Tax Paid | Tax Assessment Tax Assessment Total Assessment is a certain percentage of the fair market value that is determined by local assessors to be the total taxable value of land and additions on the property. | Land | Improvement |
|---|---|---|---|---|
| 2025 | $2,434 | $238,295 | $83,402 | $154,893 |
| 2024 | $2,434 | $233,623 | $81,767 | $151,856 |
| 2023 | $2,377 | $229,042 | $80,164 | $148,878 |
| 2022 | $2,333 | $224,551 | $78,592 | $145,959 |
| 2021 | $2,312 | $220,148 | $77,051 | $143,097 |
| 2020 | $2,270 | $217,891 | $76,261 | $141,630 |
| 2019 | $2,256 | $213,619 | $74,766 | $138,853 |
| 2018 | $2,199 | $209,430 | $73,300 | $136,130 |
| 2017 | $2,118 | $205,324 | $71,863 | $133,461 |
| 2016 | $2,089 | $201,298 | $70,454 | $130,844 |
| 2015 | $2,074 | $198,275 | $69,396 | $128,879 |
| 2014 | -- | $194,391 | $68,037 | $126,354 |
Source: Public Records
Map
Nearby Homes
- 9330 Alderwood Dr
- 2008 E 5th St
- 9403 Old Post Dr
- 2139 E 4th St #244 St Unit 244
- 2139 E 4th St Unit 230
- 2139 E 4th St Unit 176
- 2139 E 4th St Unit 13
- 2139 E 4th St Unit 135
- 2139 E 4th St Unit 244
- 2139 E 4th St Unit 39
- 2139 E 4th St Unit 142
- 1120 N Solano Privado Unit A
- 9523 Sunglow Ct
- 9357 Culinary Place
- 9593 Brook Dr
- 9550 Springbrook Ct
- 9552 Cameron St
- 9427 Sun Meadow Ct
- 9175 Jadeite Ave
- 914 N Placer Ave
- 1359 La Mancha Way
- 1371 La Mancha Way
- 1366 N Hacienda Dr
- 1349 La Mancha Way
- 1360 N Hacienda Dr
- 1419 La Mancha Way
- 1372 N Hacienda Dr
- 1354 N Hacienda Dr
- 1366 La Mancha Way
- 1343 La Mancha Way
- 1420 N Hacienda Dr
- 1360 La Mancha Way
- 1348 N Hacienda Dr
- 1354 La Mancha Way
- 1425 La Mancha Way
- 1430 La Mancha Way
- 1337 La Mancha Way
- 1428 N Hacienda Dr
- 1342 N Hacienda Dr
- 1431 La Mancha Way