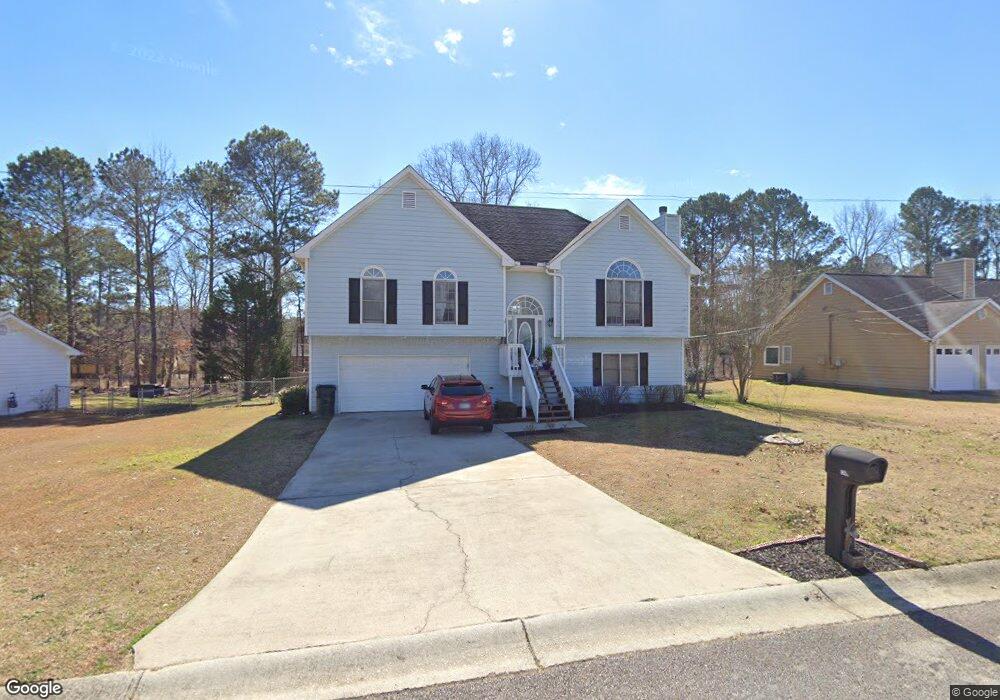
1365 Shamrock Hill Cir Unit 11 Loganville, GA 30052
Estimated Value: $332,000 - $355,000
5
Beds
3
Baths
1,991
Sq Ft
$172/Sq Ft
Est. Value
About This Home
This home is located at 1365 Shamrock Hill Cir Unit 11, Loganville, GA 30052 and is currently estimated at $342,265, approximately $171 per square foot. 1365 Shamrock Hill Cir Unit 11 is a home located in Gwinnett County with nearby schools including Magill Elementary School, Grace Snell Middle School, and South Gwinnett High School.
Ownership History
Date
Name
Owned For
Owner Type
Purchase Details
Closed on
May 28, 2019
Sold by
Medrano-Carrill Juan L
Bought by
Dominguez Yizy K Marte and Reinoso Edsel Antonio Vila
Current Estimated Value
Home Financials for this Owner
Home Financials are based on the most recent Mortgage that was taken out on this home.
Original Mortgage
$195,713
Outstanding Balance
$172,080
Interest Rate
4.1%
Mortgage Type
New Conventional
Estimated Equity
$170,185
Purchase Details
Closed on
Nov 29, 2017
Sold by
Scheider Patrick Robert
Bought by
Medrano-Carrill Juan L
Purchase Details
Closed on
May 12, 1993
Sold by
Oaktree Mgmnt Inc
Bought by
Scheider Robert P Linda
Home Financials for this Owner
Home Financials are based on the most recent Mortgage that was taken out on this home.
Original Mortgage
$101,250
Interest Rate
7.39%
Mortgage Type
VA
Create a Home Valuation Report for This Property
The Home Valuation Report is an in-depth analysis detailing your home's value as well as a comparison with similar homes in the area
Home Values in the Area
Average Home Value in this Area
Purchase History
| Date | Buyer | Sale Price | Title Company |
|---|---|---|---|
| Dominguez Yizy K Marte | $195,713 | -- | |
| Medrano-Carrill Juan L | $160,000 | -- | |
| Scheider Robert P Linda | $104,700 | -- |
Source: Public Records
Mortgage History
| Date | Status | Borrower | Loan Amount |
|---|---|---|---|
| Open | Dominguez Yizy K Marte | $195,713 | |
| Previous Owner | Scheider Robert P Linda | $101,250 |
Source: Public Records
Tax History Compared to Growth
Tax History
| Year | Tax Paid | Tax Assessment Tax Assessment Total Assessment is a certain percentage of the fair market value that is determined by local assessors to be the total taxable value of land and additions on the property. | Land | Improvement |
|---|---|---|---|---|
| 2024 | $3,826 | $125,120 | $30,000 | $95,120 |
| 2023 | $3,826 | $117,080 | $29,680 | $87,400 |
| 2022 | $3,659 | $118,840 | $19,200 | $99,640 |
| 2021 | $2,852 | $78,280 | $12,000 | $66,280 |
| 2020 | $2,868 | $78,280 | $12,000 | $66,280 |
| 2019 | $2,875 | $73,320 | $11,200 | $62,120 |
| 2018 | $2,540 | $64,000 | $8,000 | $56,000 |
| 2016 | $673 | $55,520 | $7,200 | $48,320 |
| 2015 | $682 | $45,760 | $7,200 | $38,560 |
| 2014 | -- | $26,080 | $4,000 | $22,080 |
Source: Public Records
Map
Nearby Homes
- 1010 Burning Bush Dr Unit 2
- 3715 Heron Creek Ct
- 3705 Heron Creek Ct
- 1361 Stephens View Dr
- 1371 Stephens View Dr
- 3633 Squires Park Ln
- 3623 Squires Park Ln
- 3604 Squires Park Ln
- 3725 Heron Creek Ct
- 3405 Linstead Ct
- 3624 Squires Park Ln
- 3614 Squires Park Ln
- 1471 Stephens View Dr
- 3315 Linstead Ct Unit 2A
- 3315 Linstead Ct
- The Wesley Plan at Soleil at Summit Chase - Summit Chase
- The Weston Plan at Soleil at Summit Chase - Summit Chase
- The Denton Plan at Soleil at Summit Chase - Summit Chase
- The Jefferson Plan at Soleil at Summit Chase - Summit Chase
- The Auburn Plan at Soleil at Summit Chase - Summit Chase
- 1365 Shamrock Hill Cir
- 1355 Shamrock Hill Cir Unit 1
- 1375 Shamrock Hill Cir Unit 1
- 1345 Shamrock Hill Cir
- 1360 Shamrock Hill Cir
- 1370 Shamrock Hill Cir Unit 1
- 1350 Shamrock Hill Cir Unit 1
- 1385 Shamrock Hill Cir
- 940 Burning Bush Dr Unit 2
- 950 Burning Bush Dr
- 1335 Shamrock Hill Cir
- 930 Burning Bush Dr
- 960 Burning Bush Dr Unit 2
- 0 Thrush Ct Unit 7387851
- 0 Thrush Ct Unit 3161326
- 0 Thrush Ct Unit 8154471
- 0 Thrush Ct Unit 8098330
- 0 Thrush Ct
- 1395 Shamrock Hill Cir
- 1410 Shamrock Hill Cir