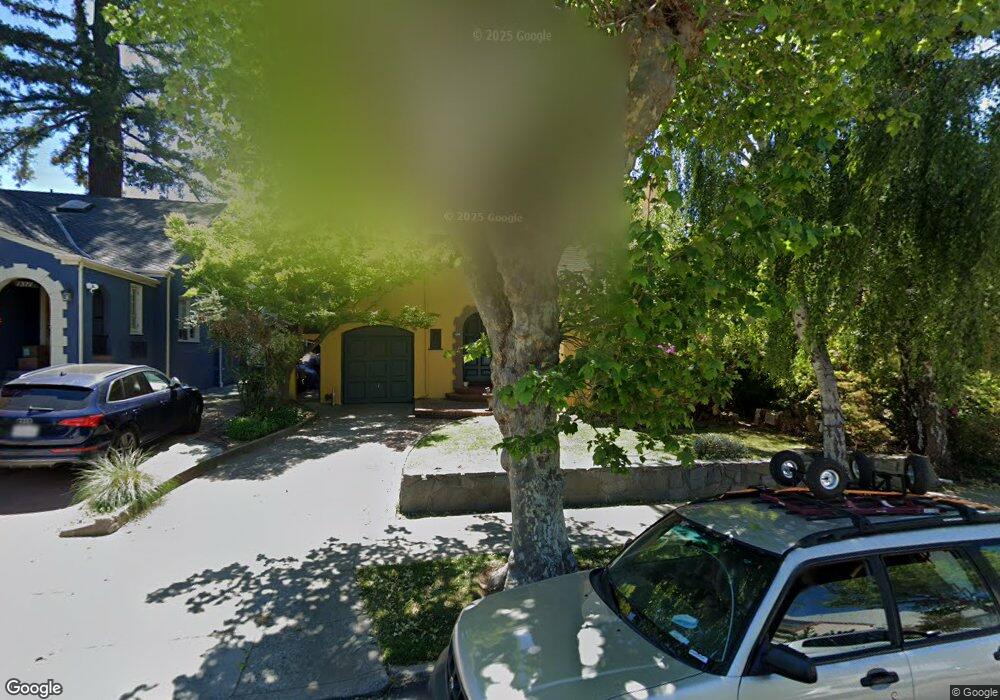
1365 Trestle Glen Rd Oakland, CA 94610
Crocker Highlands NeighborhoodEstimated Value: $1,023,989 - $1,392,000
2
Beds
2
Baths
1,741
Sq Ft
$715/Sq Ft
Est. Value
About This Home
This home is located at 1365 Trestle Glen Rd, Oakland, CA 94610 and is currently estimated at $1,245,247, approximately $715 per square foot. 1365 Trestle Glen Rd is a home located in Alameda County with nearby schools including Crocker Highlands Elementary School, Edna Brewer Middle School, and Oakland High School.
Ownership History
Date
Name
Owned For
Owner Type
Purchase Details
Closed on
Mar 8, 2018
Sold by
Thogersen Lise M
Bought by
Thogersen Lise M and Lise M Thogersen Trust
Current Estimated Value
Purchase Details
Closed on
Aug 2, 2016
Sold by
Thogersen Erik N and Ole Z Thogersen 2001 Revocable
Bought by
Thogersen Erik N and Thogersen Lise M
Purchase Details
Closed on
Mar 8, 2012
Sold by
Thogersen Ole Z and Thogerson Lise M
Bought by
Thogersen Erik and Ole Z Thogersen 2001 Revocable
Purchase Details
Closed on
Jan 30, 2004
Sold by
Thogersen Ole Z
Bought by
Thogersen Ole Z and The Ole Z Thogersen 2001 Revoc
Purchase Details
Closed on
Mar 27, 2002
Sold by
Thogersen Ole Z
Bought by
Ole Z Thogersen 2001 Revocable Trust
Purchase Details
Closed on
May 1, 2001
Sold by
Thogersen Ole Z
Bought by
Domestic Ole Z Thogersen 2001 Qualified
Create a Home Valuation Report for This Property
The Home Valuation Report is an in-depth analysis detailing your home's value as well as a comparison with similar homes in the area
Home Values in the Area
Average Home Value in this Area
Purchase History
| Date | Buyer | Sale Price | Title Company |
|---|---|---|---|
| Thogersen Lise M | -- | None Available | |
| Thogersen Erik N | -- | None Available | |
| Thogersen Erik | -- | None Available | |
| Thogersen Ole Z | -- | -- | |
| Ole Z Thogersen 2001 Revocable Trust | -- | -- | |
| Domestic Ole Z Thogersen 2001 Qualified | -- | -- |
Source: Public Records
Tax History Compared to Growth
Tax History
| Year | Tax Paid | Tax Assessment Tax Assessment Total Assessment is a certain percentage of the fair market value that is determined by local assessors to be the total taxable value of land and additions on the property. | Land | Improvement |
|---|---|---|---|---|
| 2025 | $2,760 | $73,908 | $44,377 | $36,531 |
| 2024 | $2,760 | $72,322 | $43,507 | $35,815 |
| 2023 | $2,769 | $77,767 | $42,654 | $35,113 |
| 2022 | $2,621 | $69,242 | $41,818 | $34,424 |
| 2021 | $2,347 | $67,747 | $40,998 | $33,749 |
| 2020 | $2,318 | $73,980 | $40,577 | $33,403 |
| 2019 | $2,130 | $72,531 | $39,782 | $32,749 |
| 2018 | $2,088 | $71,108 | $39,002 | $32,106 |
| 2017 | $1,970 | $69,714 | $38,237 | $31,477 |
| 2016 | $1,809 | $68,347 | $37,487 | $30,860 |
| 2015 | $1,794 | $67,320 | $36,924 | $30,396 |
| 2014 | $1,694 | $66,002 | $36,201 | $29,801 |
Source: Public Records
Map
Nearby Homes
- 1415 Trestle Glen Rd
- 1462 Trestle Glen Rd
- 3937 Greenwood Ave
- 1233 Hampel St
- 4033 Park Blvd
- 1107 Wellington St
- 953 Grosvenor Place
- 3747 Park Boulevard Way
- 542 Midcrest Rd
- 3945 Randolph Ave Unit 2
- 1063 Clarendon Crescent
- 1002 Everett Ave
- 3828 Glen Park Rd
- 725 Carlston Ave
- 3622 Emerson St
- 801 Mandana Blvd
- 1371 Trestle Glen Rd
- 1357 Trestle Glen Rd
- 1376 Barrows Rd
- 1377 Trestle Glen Rd
- 1370 Barrows Rd
- 1384 Barrows Rd
- 1362 Barrows Rd
- 1388 Barrows Rd
- 1347 Trestle Glen Rd
- 1383 Trestle Glen Rd
- 1394 Barrows Rd
- 1354 Barrows Rd
- 1389 Trestle Glen Rd
- 1362 Trestle Glen Rd
- 1339 Trestle Glen Rd
- 1368 Trestle Glen Rd
- 1356 Trestle Glen Rd
- 1400 Barrows Rd
- 1346 Barrows Rd
- 1348 Trestle Glen Rd