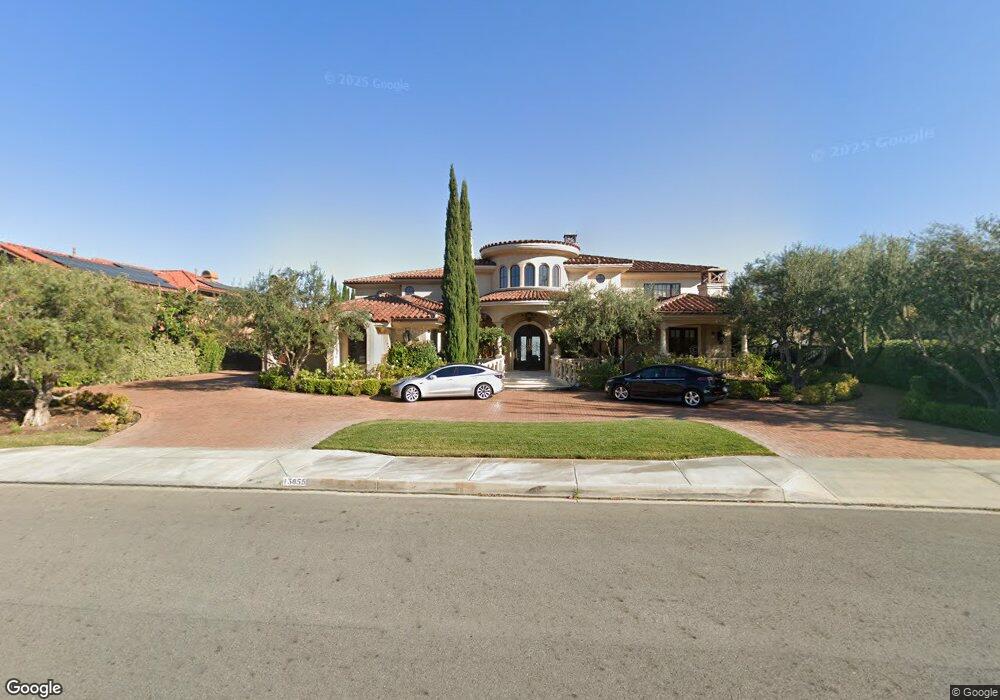
13655 Monteverde Dr Chino Hills, CA 91709
North Chino Hills NeighborhoodEstimated Value: $3,210,000 - $3,262,000
4
Beds
7
Baths
6,853
Sq Ft
$473/Sq Ft
Est. Value
About This Home
This home is located at 13655 Monteverde Dr, Chino Hills, CA 91709 and is currently estimated at $3,243,846, approximately $473 per square foot. 13655 Monteverde Dr is a home with nearby schools including Canyon Hills Junior High School, Ruben S. Ayala High School, and Heights Christian Schools - Chino Hills Elementary.
Ownership History
Date
Name
Owned For
Owner Type
Purchase Details
Closed on
Jun 5, 2024
Sold by
Mehta Pran Nath and Mehta Neeru
Bought by
Mehta Family Trust and Mehta
Current Estimated Value
Purchase Details
Closed on
Aug 28, 2014
Sold by
Mehta Pran
Bought by
Mehta Pran and Mehta Neeru
Home Financials for this Owner
Home Financials are based on the most recent Mortgage that was taken out on this home.
Original Mortgage
$1,610,000
Interest Rate
4.08%
Mortgage Type
Construction
Purchase Details
Closed on
Feb 26, 2001
Sold by
Shea George Lap Kwan
Bought by
Mehta Pran and Mehta Mehru
Home Financials for this Owner
Home Financials are based on the most recent Mortgage that was taken out on this home.
Original Mortgage
$250,000
Interest Rate
7.19%
Mortgage Type
Credit Line Revolving
Purchase Details
Closed on
Jan 6, 1995
Sold by
Shea George Lap Kwan
Bought by
Shea George Lap Kwan and Ip Sylvia Lai Wah
Create a Home Valuation Report for This Property
The Home Valuation Report is an in-depth analysis detailing your home's value as well as a comparison with similar homes in the area
Home Values in the Area
Average Home Value in this Area
Purchase History
| Date | Buyer | Sale Price | Title Company |
|---|---|---|---|
| Mehta Family Trust | -- | None Listed On Document | |
| Mehta Pran Nath | -- | None Listed On Document | |
| Mehta Pran | -- | Old Republic Title | |
| Mehta Pran | $300,000 | Fidelity National Title Ins | |
| Shea George Lap Kwan | -- | -- | |
| Shea George Lap Kwan | -- | -- |
Source: Public Records
Mortgage History
| Date | Status | Borrower | Loan Amount |
|---|---|---|---|
| Previous Owner | Mehta Pran | $1,610,000 | |
| Previous Owner | Mehta Pran | $250,000 |
Source: Public Records
Tax History Compared to Growth
Tax History
| Year | Tax Paid | Tax Assessment Tax Assessment Total Assessment is a certain percentage of the fair market value that is determined by local assessors to be the total taxable value of land and additions on the property. | Land | Improvement |
|---|---|---|---|---|
| 2025 | $24,358 | $2,174,733 | $452,058 | $1,722,675 |
| 2024 | $24,358 | $2,132,091 | $443,194 | $1,688,897 |
| 2023 | $23,693 | $2,090,285 | $434,504 | $1,655,781 |
| 2022 | $23,543 | $2,049,299 | $425,984 | $1,623,315 |
| 2021 | $23,088 | $2,009,116 | $417,631 | $1,591,485 |
| 2020 | $22,786 | $1,988,515 | $413,349 | $1,575,166 |
| 2019 | $22,388 | $1,949,524 | $405,244 | $1,544,280 |
| 2018 | $21,512 | $1,876,298 | $397,298 | $1,479,000 |
| 2017 | $20,318 | $1,764,507 | $389,507 | $1,375,000 |
| 2016 | $4,256 | $381,870 | $381,870 | $0 |
| 2015 | $4,175 | $376,134 | $376,134 | $0 |
| 2014 | $4,097 | $368,766 | $368,766 | $0 |
Source: Public Records
Map
Nearby Homes
- 13663 Monteverde Dr
- 13470 Palamos Place
- 13593 Monte Royale Dr
- 2308 Wandering Ridge Dr
- 14155 Applegate Ln
- 2155 Camino Largo Dr
- 14171 Shoreline Dr
- 13133 Le Parc Unit 308
- 13530 Tawny Ln
- 2179 Woodhollow Ln
- 13255 Sonrisa Dr
- 13149 Pinnacle Ct
- 13151 Pinnacle Ct
- 2598 Highgate Ct
- 13115 Le Parc Unit 8
- 13163 Pinnacle Ct
- 13194 Spire Cir
- 13104 Glen Ct Unit 7
- 2286 Black Pine Rd
- 2396 Scenic Ridge Dr
- 13647 Monteverde Dr
- 13651 Monteverde Dr
- 13639 Monteverde Dr
- 2171 Avenida Las Ramblas
- 13646 Monteverde Dr
- 13654 Monteverde Dr
- 13671 Monteverde Dr
- 13638 Monteverde Dr
- 2229 Avenida Las Ramblas
- 2211 Avenida Las Ramblas
- 13679 Monteverde Dr
- 13670 Monteverde Dr
- 2160 Ave Las Ramblas
- 2160 Avenida Las Ramblas
- 13630 Monteverde Dr
- 2253 Avenida Las Ramblas
- 2172 Avenida Las Ramblas
- 13687 Monteverde Dr
- 2259 Avenida Las Ramblas
- 2259 Ave Las Ramblas