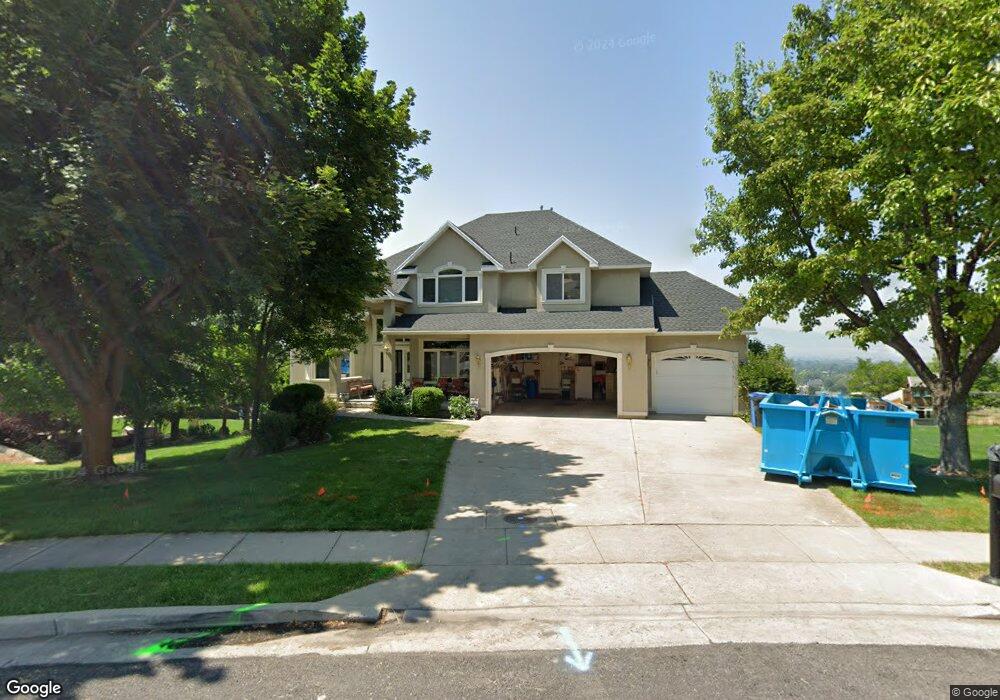
1366 Mount Logan Loop Logan, UT 84321
Wilson NeighborhoodEstimated Value: $698,000 - $953,000
6
Beds
4
Baths
5,020
Sq Ft
$161/Sq Ft
Est. Value
About This Home
This home is located at 1366 Mount Logan Loop, Logan, UT 84321 and is currently estimated at $808,167, approximately $160 per square foot. 1366 Mount Logan Loop is a home located in Cache County with nearby schools including Wilson School, Mount Logan Middle School, and Logan High School.
Ownership History
Date
Name
Owned For
Owner Type
Purchase Details
Closed on
May 22, 2020
Sold by
Baker David and Baker Susan J
Bought by
Baker David and Baker Susan J
Current Estimated Value
Home Financials for this Owner
Home Financials are based on the most recent Mortgage that was taken out on this home.
Original Mortgage
$450,000
Interest Rate
3.3%
Mortgage Type
New Conventional
Purchase Details
Closed on
Oct 5, 2011
Sold by
Baker D Douglas and Baker Susan
Bought by
Baker David D and Baker Susan J
Home Financials for this Owner
Home Financials are based on the most recent Mortgage that was taken out on this home.
Original Mortgage
$269,000
Interest Rate
4.16%
Mortgage Type
New Conventional
Purchase Details
Closed on
Apr 20, 2007
Sold by
Baker David Douglas and Baker Susan Jane
Bought by
Baker David D and Baker Susan J
Create a Home Valuation Report for This Property
The Home Valuation Report is an in-depth analysis detailing your home's value as well as a comparison with similar homes in the area
Home Values in the Area
Average Home Value in this Area
Purchase History
| Date | Buyer | Sale Price | Title Company |
|---|---|---|---|
| Baker David | -- | Hickman Land Title Logan | |
| Baker David D | -- | Hickman Land Title Logan | |
| Baker David D | -- | Cache Title Company | |
| Baker D Douglas | -- | Cache Title Company | |
| Baker David D | -- | None Available |
Source: Public Records
Mortgage History
| Date | Status | Borrower | Loan Amount |
|---|---|---|---|
| Closed | Baker David D | $450,000 | |
| Closed | Baker D Douglas | $269,000 |
Source: Public Records
Tax History
| Year | Tax Paid | Tax Assessment Tax Assessment Total Assessment is a certain percentage of the fair market value that is determined by local assessors to be the total taxable value of land and additions on the property. | Land | Improvement |
|---|---|---|---|---|
| 2025 | $3,158 | $408,385 | $0 | $0 |
| 2024 | $3,242 | $406,055 | $0 | $0 |
| 2023 | $3,468 | $414,055 | $0 | $0 |
| 2022 | $3,319 | $370,055 | $0 | $0 |
| 2021 | $3,264 | $562,260 | $120,000 | $442,260 |
| 2020 | $3,141 | $487,000 | $120,000 | $367,000 |
| 2019 | $3,612 | $487,000 | $120,000 | $367,000 |
| 2018 | $3,555 | $481,460 | $120,000 | $361,460 |
| 2017 | $3,062 | $219,230 | $0 | $0 |
| 2016 | $3,174 | $219,230 | $0 | $0 |
| 2015 | $2,537 | $175,005 | $0 | $0 |
| 2014 | $2,293 | $175,005 | $0 | $0 |
| 2013 | -- | $175,005 | $0 | $0 |
Source: Public Records
Map
Nearby Homes
- 1131 E Lamplighter Dr
- 128 S 1170 E
- 1147 Eastridge Dr
- 720 E 525 N Unit 32
- 529 N 470 E
- 676 N 275 E Unit 614
- 263 E 690 N
- 74 Canterbury Cir
- 1164 E Mountain Rd
- 1647 E Quail Canyon Dr
- 579 S 850 E
- 192 E 610 N
- 192 E 610 N Unit 415
- 561 N 225 E
- 304 N Sherwood Dr
- 205 E 520 N
- 602 E 300 N
- 147 Winding Way Unit 50
- 1034 Thrushwood Dr
- 188 E 520 N
- 1352 Mount Logan Loop
- 1378 Mount Logan Loop
- 376 S Red Fox Trace
- 376 S Red Fox Trace Unit 2
- 1353 Palisade Cir
- 392 Red Fox Trace
- 1373 Palisade Cir
- 1396 Mount Logan Loop
- 344 Red Fox Trace
- 377 Red Fox Trace Unit 19
- 1387 Palisade Cir
- 424 S Red Fox Trace
- 424 S Red Fox Trace Unit 6
- 424 S Red Fox Trace Unit 4
- 385 S Red Fox Trace
- 1358 Palisade Cir
- 355 S Red Fox Trace
- 391 S Red Fox Trace
- 1361 Mount Logan Loop
- 333 S Red Fox Trace
Your Personal Tour Guide
Ask me questions while you tour the home.