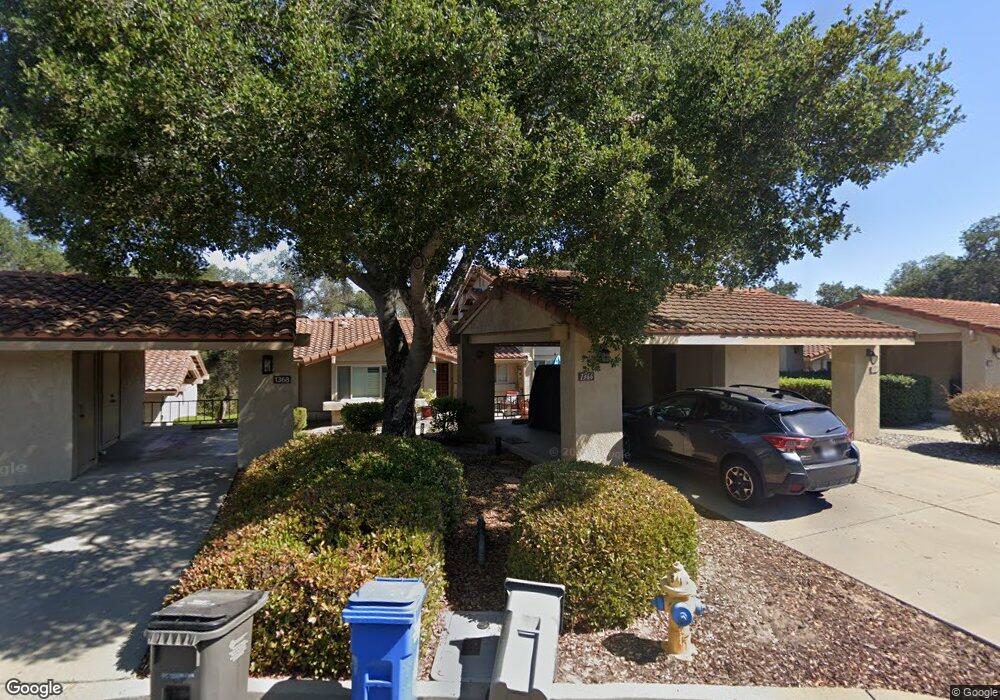
1366 Tourney Hill Ln Nipomo, CA 93444
Blacklake NeighborhoodEstimated Value: $528,265 - $553,000
2
Beds
1
Bath
1,021
Sq Ft
$532/Sq Ft
Est. Value
About This Home
This home is located at 1366 Tourney Hill Ln, Nipomo, CA 93444 and is currently estimated at $542,816, approximately $531 per square foot. 1366 Tourney Hill Ln is a home located in San Luis Obispo County with nearby schools including Dorothea Lange Elementary School, Mesa Middle School, and Nipomo High School.
Ownership History
Date
Name
Owned For
Owner Type
Purchase Details
Closed on
Oct 22, 2019
Sold by
Lowery Billie S and Lowery Kimberly L
Bought by
Hogarty Lisa A
Current Estimated Value
Purchase Details
Closed on
Jul 24, 2018
Sold by
Ditzler David P and Ditzler Robin R
Bought by
Lowery Billie S and Lowery Kimberly L
Purchase Details
Closed on
Sep 30, 2009
Sold by
Barstow Robert and Barstow Diane L
Bought by
Ditzler David P and Ditzler Robin R
Purchase Details
Closed on
Sep 14, 2009
Sold by
Barstow Diane L and Bruce G Emery Trust
Bought by
Barstow Robert and Barstow Diane L
Purchase Details
Closed on
May 12, 2003
Sold by
Cutler Katie
Bought by
Emery Bruce G and Bruce G Emery Trust
Create a Home Valuation Report for This Property
The Home Valuation Report is an in-depth analysis detailing your home's value as well as a comparison with similar homes in the area
Home Values in the Area
Average Home Value in this Area
Purchase History
| Date | Buyer | Sale Price | Title Company |
|---|---|---|---|
| Hogarty Lisa A | $407,000 | Fidelity National Title Co | |
| Lowery Billie S | $402,500 | First American Title | |
| Ditzler David P | $230,000 | Fidelity National Title Co | |
| Barstow Robert | -- | None Available | |
| Emery Bruce G | $320,000 | Chicago Title Company |
Source: Public Records
Tax History Compared to Growth
Tax History
| Year | Tax Paid | Tax Assessment Tax Assessment Total Assessment is a certain percentage of the fair market value that is determined by local assessors to be the total taxable value of land and additions on the property. | Land | Improvement |
|---|---|---|---|---|
| 2025 | $5,693 | $445,108 | $229,663 | $215,445 |
| 2024 | $5,648 | $436,381 | $225,160 | $211,221 |
| 2023 | $5,648 | $427,826 | $220,746 | $207,080 |
| 2022 | $5,589 | $419,438 | $216,418 | $203,020 |
| 2021 | $4,426 | $411,215 | $212,175 | $199,040 |
| 2020 | $4,375 | $407,000 | $210,000 | $197,000 |
| 2019 | $4,341 | $398,500 | $230,000 | $168,500 |
| 2018 | $2,933 | $260,916 | $147,474 | $113,442 |
| 2017 | $2,873 | $255,801 | $144,583 | $111,218 |
| 2016 | $2,712 | $250,787 | $141,749 | $109,038 |
| 2015 | $2,674 | $247,021 | $139,620 | $107,401 |
| 2014 | $2,577 | $242,184 | $136,886 | $105,298 |
Source: Public Records
Map
Nearby Homes
- 1337 Black Sage Cir
- 639 Barberry Way
- 1150 Redberry Place
- 1060 Dawn Rd
- 1225 Dawn Rd
- 1790 Calle Laguna
- 1276 Pomeroy Rd
- 462 Camino Perillo
- 808 Albert Way
- 708 Albert Way
- 1024 Maggie Ln
- 940 Calle Fresa
- 1354 Trail View Place
- 961 Jacqueline Place
- 977 Jacqueline Place
- 1084 Emma Ln
- 1539 Vista Tesoro Place
- 1441 Vicki Ln
- 1950 Lemon Ranch Rd
- 1147 Vaquero Way
- 1366 Tourney Hill Ln Unit 49
- 1364 Tourney Hill Ln Unit 50
- 1364 Tourney Hill Ln
- 1368 Tourney Hill Ln Unit 48
- 1368 Tourney Hill Ln
- 1362 Tourney Hill Ln Unit 51
- 1362 Tourney Hill Ln
- 1370 Tourney Hill Ln
- 1360 Tourney Hill Ln
- 1372 Tourney Hill Ln
- 1374 Tourney Hill Ln
- 1358 Tourney Hill Ln Unit 53
- 1358 Tourney Hill Ln
- 1356 Tourney Hill Ln Unit 54
- 1356 Tourney Hill Ln
- 1376 Tourney Hill Ln Unit 44
- 1376 Tourney Hill Ln
- 1354 Tourney Hill Ln Unit 55
- 1354 Tourney Hill Ln
- 1378 Tourney Hill Ln