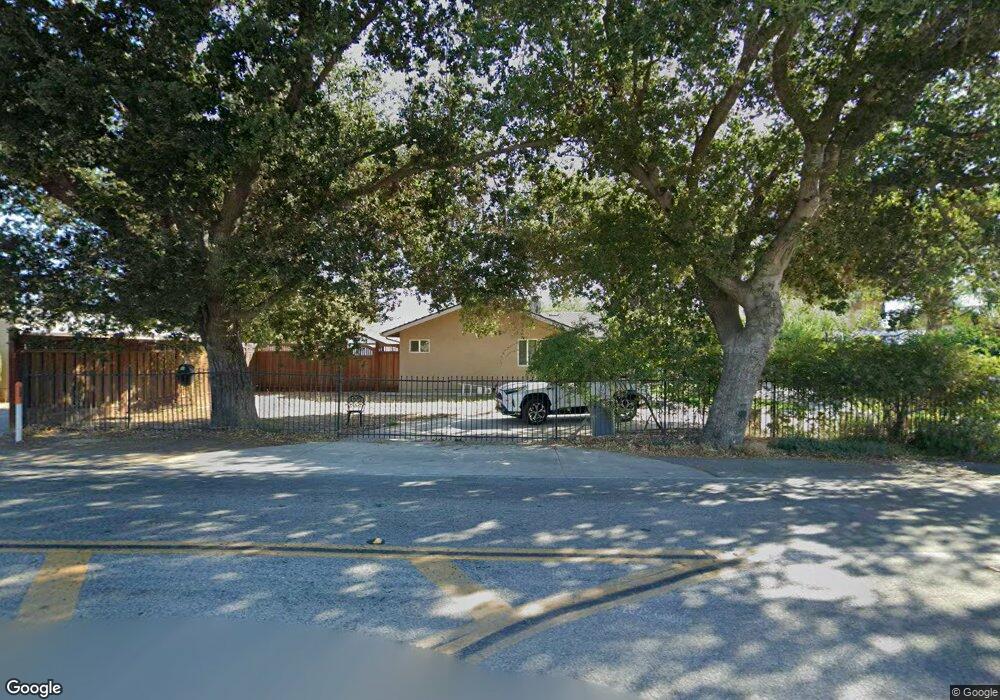
13660 Llagas Ave San Martin, CA 95046
Estimated Value: $1,295,190 - $1,994,000
3
Beds
2
Baths
1,040
Sq Ft
$1,457/Sq Ft
Est. Value
About This Home
This home is located at 13660 Llagas Ave, San Martin, CA 95046 and is currently estimated at $1,515,048, approximately $1,456 per square foot. 13660 Llagas Ave is a home located in Santa Clara County with nearby schools including San Martin/Gwinn Environmental Science Academy, Britton Middle School, and Live Oak High School.
Ownership History
Date
Name
Owned For
Owner Type
Purchase Details
Closed on
May 17, 2022
Sold by
Chavarria Juan Carlos and Gallegos Ariana
Bought by
Chavarria Family Trust and Chavarria
Current Estimated Value
Purchase Details
Closed on
Jun 19, 2015
Sold by
Gallegos Ariana and Chavarria Juan C
Bought by
Santa Clara Valley Water District
Purchase Details
Closed on
Sep 16, 2009
Sold by
Lane Walter R and Lane Martha
Bought by
Gallegos Ariana and Chavarria Juan C
Home Financials for this Owner
Home Financials are based on the most recent Mortgage that was taken out on this home.
Original Mortgage
$589,132
Interest Rate
5.25%
Mortgage Type
FHA
Purchase Details
Closed on
Feb 14, 2006
Sold by
Lane Walter and Lane Martha
Bought by
Lane Walter R and Lane Martha
Create a Home Valuation Report for This Property
The Home Valuation Report is an in-depth analysis detailing your home's value as well as a comparison with similar homes in the area
Home Values in the Area
Average Home Value in this Area
Purchase History
| Date | Buyer | Sale Price | Title Company |
|---|---|---|---|
| Chavarria Family Trust | -- | Anthoor Swapna | |
| Santa Clara Valley Water District | -- | Old Republic Title Company | |
| Gallegos Ariana | $600,000 | Chicago Title Company | |
| Lane Walter R | -- | None Available |
Source: Public Records
Mortgage History
| Date | Status | Borrower | Loan Amount |
|---|---|---|---|
| Previous Owner | Gallegos Ariana | $589,132 |
Source: Public Records
Tax History Compared to Growth
Tax History
| Year | Tax Paid | Tax Assessment Tax Assessment Total Assessment is a certain percentage of the fair market value that is determined by local assessors to be the total taxable value of land and additions on the property. | Land | Improvement |
|---|---|---|---|---|
| 2025 | $8,209 | $722,850 | $387,241 | $335,609 |
| 2024 | $8,209 | $708,678 | $379,649 | $329,029 |
| 2023 | $8,104 | $694,783 | $372,205 | $322,578 |
| 2022 | $7,888 | $681,160 | $364,907 | $316,253 |
| 2021 | $7,689 | $667,804 | $357,752 | $310,052 |
| 2020 | $7,504 | $660,957 | $354,084 | $306,873 |
| 2019 | $7,713 | $647,998 | $347,142 | $300,856 |
| 2018 | $7,734 | $635,293 | $340,336 | $294,957 |
| 2017 | $7,660 | $622,837 | $333,663 | $289,174 |
| 2016 | $7,173 | $610,625 | $327,121 | $283,504 |
| 2015 | $7,095 | $601,454 | $322,208 | $279,246 |
| 2014 | $7,191 | $589,673 | $315,897 | $273,776 |
Source: Public Records
Map
Nearby Homes
- 0 Llagas Ave Unit ML82019140
- 0 W San Martin Ave
- 13690 Murphy Ave #E
- 30 Chester Ave
- 13705 Sycamore Ave
- 13640 Sycamore Ave
- 905 E San Martin Ave
- 14325 Monterey Rd
- 12645 Harding Ave
- 14430 Monterey Hwy
- 13755 Columbet Ave
- 475 E Middle Ave
- 0 Seymour Ave Unit 225017465
- 13035 Center Ave
- 12755 Santa Teresa Blvd
- 12320 Highland Estates Ln
- 42 Dewey Cir
- 12315 Harding Ave
- 56 Creekside Dr Unit 56
- 92 Melody Ln Unit 92
- 13626 Llagas Ave
- 13630 Llagas Ave
- 13690 Llagas Ave
- 13620 Llagas Ave
- 13720 Llagas Ave
- 13740 Llagas Ave
- 13610 Llagas Ave
- 14510 Llagas Ave
- 13550 Llagas Ave
- 13792 Llagas Ave
- 13790 Llagas Ave
- 13820 Llagas Ave
- 13520 Llagas Ave
- 13795 Llagas Ave
- 0 Llagas Ave Unit ML81204410
- 0 Llagas Ave Unit ML81204409
- 0 Llagas Ave Unit ML81971016
- 0 Llagas Ave Unit ML81799873
- 13580 Depot St
- 13570 Depot St