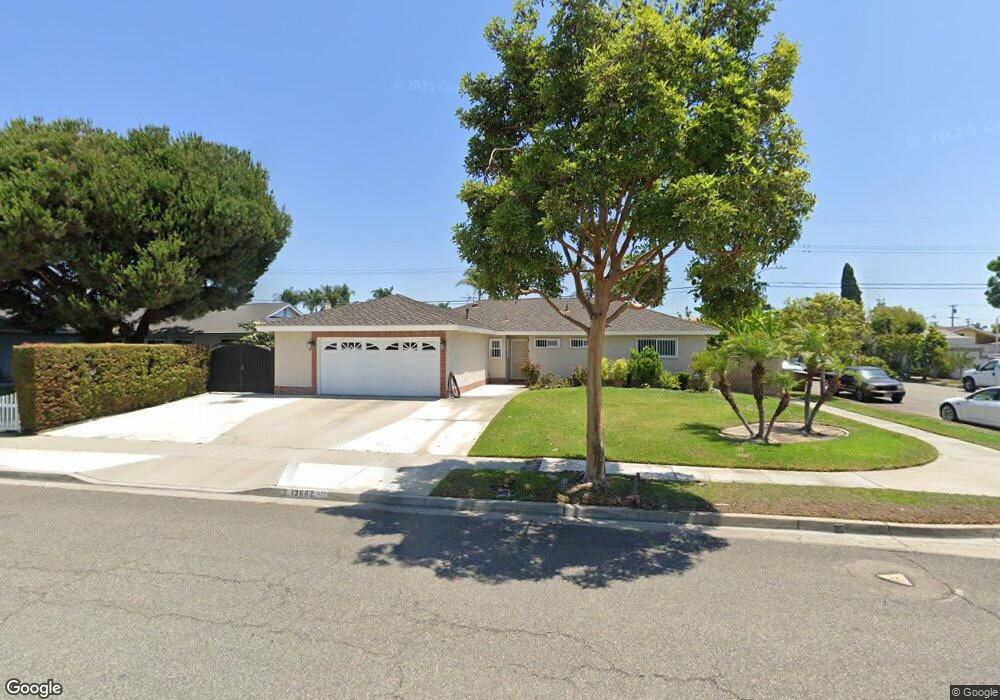
13662 Purdy St Garden Grove, CA 92844
Estimated Value: $959,686 - $1,138,000
4
Beds
2
Baths
1,388
Sq Ft
$755/Sq Ft
Est. Value
About This Home
This home is located at 13662 Purdy St, Garden Grove, CA 92844 and is currently estimated at $1,047,922, approximately $754 per square foot. 13662 Purdy St is a home located in Orange County with nearby schools including Anderson Elementary School, Warner Middle, and Westminster High School.
Ownership History
Date
Name
Owned For
Owner Type
Purchase Details
Closed on
Sep 22, 2006
Sold by
Jeong Heesue
Bought by
Ngo Soukheng
Current Estimated Value
Purchase Details
Closed on
Oct 13, 2004
Sold by
Jeong Heesue
Bought by
Ngo Soukheng
Home Financials for this Owner
Home Financials are based on the most recent Mortgage that was taken out on this home.
Original Mortgage
$384,000
Outstanding Balance
$189,480
Interest Rate
5.82%
Mortgage Type
Purchase Money Mortgage
Estimated Equity
$858,442
Purchase Details
Closed on
Sep 13, 2004
Sold by
Scott Malcolm E and Scott Glenys C
Bought by
Ngo Soukheng
Home Financials for this Owner
Home Financials are based on the most recent Mortgage that was taken out on this home.
Original Mortgage
$384,000
Outstanding Balance
$189,480
Interest Rate
5.82%
Mortgage Type
Purchase Money Mortgage
Estimated Equity
$858,442
Create a Home Valuation Report for This Property
The Home Valuation Report is an in-depth analysis detailing your home's value as well as a comparison with similar homes in the area
Home Values in the Area
Average Home Value in this Area
Purchase History
| Date | Buyer | Sale Price | Title Company |
|---|---|---|---|
| Ngo Soukheng | -- | None Available | |
| Ngo Soukheng | -- | Orange Coast Title | |
| Ngo Soukheng | $480,000 | Orange Coast Title |
Source: Public Records
Mortgage History
| Date | Status | Borrower | Loan Amount |
|---|---|---|---|
| Open | Ngo Soukheng | $384,000 |
Source: Public Records
Tax History Compared to Growth
Tax History
| Year | Tax Paid | Tax Assessment Tax Assessment Total Assessment is a certain percentage of the fair market value that is determined by local assessors to be the total taxable value of land and additions on the property. | Land | Improvement |
|---|---|---|---|---|
| 2025 | $7,481 | $581,053 | $527,984 | $53,069 |
| 2024 | $7,481 | $569,660 | $517,631 | $52,029 |
| 2023 | $7,229 | $558,491 | $507,482 | $51,009 |
| 2022 | $7,108 | $547,541 | $497,532 | $50,009 |
| 2021 | $6,955 | $536,805 | $487,776 | $49,029 |
| 2020 | $6,872 | $531,301 | $482,774 | $48,527 |
| 2019 | $6,750 | $520,884 | $473,308 | $47,576 |
| 2018 | $6,817 | $510,671 | $464,027 | $46,644 |
| 2017 | $6,562 | $500,658 | $454,928 | $45,730 |
| 2016 | $6,309 | $490,842 | $446,008 | $44,834 |
| 2015 | $6,197 | $483,470 | $439,309 | $44,161 |
| 2014 | $5,729 | $445,200 | $405,200 | $40,000 |
Source: Public Records
Map
Nearby Homes
- 13782 Newland St
- 8784 Hewitt Place Unit 12
- 8442 Trask Ave
- 13711 Magnolia St
- 13839 Magnolia St
- 8569 Edgebrook Dr
- 13411 Magnolia St
- 13252 Newland St Unit A-D
- 13392 Magnolia St
- 8197 Jasmine Ave
- 8202 19th St
- 8520 Lake Knoll Ave Unit B
- 8196 18th St
- 13175 Creek View Dr Unit F
- 13502 Jackson St
- 9200 Westminster Blvd Unit 25
- 8866 Grandville Cir
- 8833 Brookdale Dr
- 8800 W Garden Grove Blvd Unit 2
- 8902 Mcclure Ave
- 13642 Purdy St
- 8681 Enloe Cir
- 8681 Enloe Ave
- 13682 Purdy St
- 13661 Purdy St
- 13632 Purdy St
- 8702 Enloe Cir
- 8712 Enloe Cir
- 13671 Purdy St
- 13641 Purdy St
- 13691 Purdy St
- 13702 Purdy St
- 13631 Purdy St
- 8692 Enloe Cir
- 13622 Purdy St
- 8722 Enloe Cir
- 13661 Yockey St
- 13671 Yockey St
- 13701 Purdy St
- 13691 Yockey St