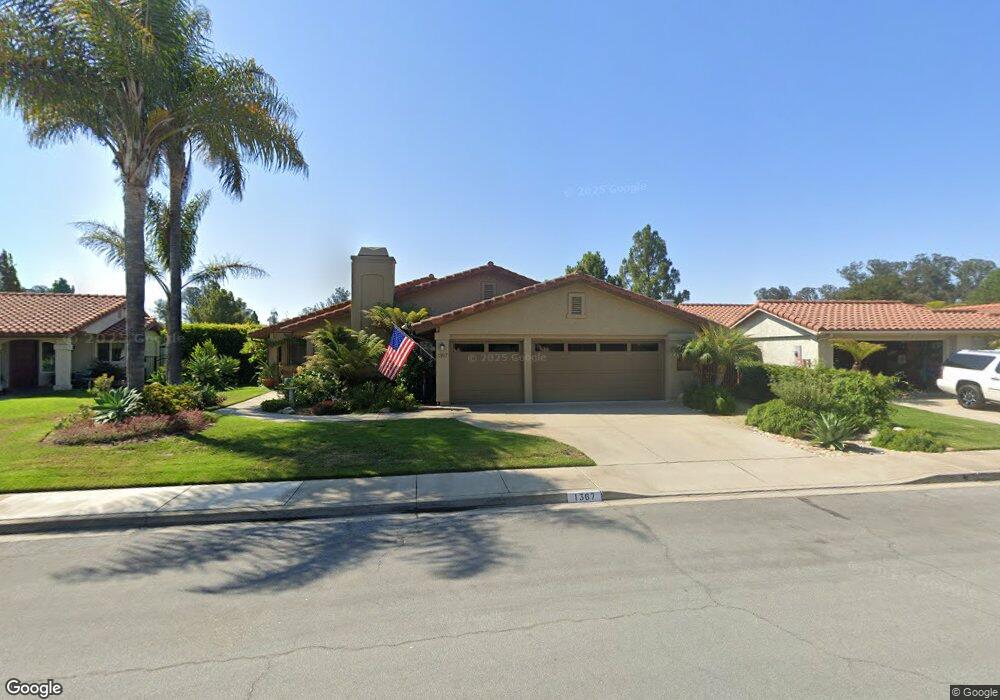
1367 Black Sage Cir Nipomo, CA 93444
Blacklake NeighborhoodEstimated Value: $824,405 - $916,000
3
Beds
2
Baths
1,823
Sq Ft
$484/Sq Ft
Est. Value
About This Home
This home is located at 1367 Black Sage Cir, Nipomo, CA 93444 and is currently estimated at $883,101, approximately $484 per square foot. 1367 Black Sage Cir is a home located in San Luis Obispo County with nearby schools including Dorothea Lange Elementary School, Mesa Middle School, and Nipomo High School.
Ownership History
Date
Name
Owned For
Owner Type
Purchase Details
Closed on
Feb 16, 2018
Sold by
Ascrizzi Carol and Vatter Trust
Bought by
Vatter Robert W and Vatter Yasmin C
Current Estimated Value
Purchase Details
Closed on
Mar 6, 1998
Sold by
Vatter Claude A and Vatter Barbara J
Bought by
Vatter Claude A and Vatter Barbara J
Purchase Details
Closed on
Aug 5, 1994
Sold by
Franklin John A and Franklin Michael
Bought by
Vatter Claude A and Vatter Barbara J
Purchase Details
Closed on
Jan 20, 1994
Sold by
Franklin John A
Bought by
Franklin John A and Franklin Michael
Home Financials for this Owner
Home Financials are based on the most recent Mortgage that was taken out on this home.
Original Mortgage
$160,000
Interest Rate
4.7%
Create a Home Valuation Report for This Property
The Home Valuation Report is an in-depth analysis detailing your home's value as well as a comparison with similar homes in the area
Home Values in the Area
Average Home Value in this Area
Purchase History
| Date | Buyer | Sale Price | Title Company |
|---|---|---|---|
| Vatter Robert W | $600,000 | Fidelity National Title Co | |
| Vatter Claude A | -- | -- | |
| Vatter Claude A | -- | Chicago Title Company | |
| Vatter Claude A | $250,000 | Chicago Title Company | |
| Franklin John A | $154,000 | First American Title Ins Co |
Source: Public Records
Mortgage History
| Date | Status | Borrower | Loan Amount |
|---|---|---|---|
| Previous Owner | Franklin John A | $160,000 |
Source: Public Records
Tax History Compared to Growth
Tax History
| Year | Tax Paid | Tax Assessment Tax Assessment Total Assessment is a certain percentage of the fair market value that is determined by local assessors to be the total taxable value of land and additions on the property. | Land | Improvement |
|---|---|---|---|---|
| 2025 | $6,382 | $505,007 | $276,835 | $228,172 |
| 2024 | $6,331 | $495,106 | $271,407 | $223,699 |
| 2023 | $6,331 | $485,399 | $266,086 | $219,313 |
| 2022 | $6,264 | $475,882 | $260,869 | $215,013 |
| 2021 | $5,100 | $466,552 | $255,754 | $210,798 |
| 2020 | $5,043 | $461,769 | $253,132 | $208,637 |
| 2019 | $5,012 | $452,716 | $248,169 | $204,547 |
| 2018 | $4,953 | $443,840 | $243,303 | $200,537 |
| 2017 | $3,967 | $361,792 | $202,605 | $159,187 |
| 2016 | $3,743 | $354,699 | $198,633 | $156,066 |
| 2015 | $3,689 | $349,372 | $195,650 | $153,722 |
| 2014 | $3,552 | $342,529 | $191,818 | $150,711 |
Source: Public Records
Map
Nearby Homes
- 1337 Black Sage Cir
- 639 Barberry Way
- 1150 Redberry Place
- 1060 Dawn Rd
- 1225 Dawn Rd
- 1276 Pomeroy Rd
- 1024 Maggie Ln
- 1790 Calle Laguna
- 940 Calle Fresa
- 808 Albert Way
- 708 Albert Way
- 462 Camino Perillo
- 1354 Trail View Place
- 961 Jacqueline Place
- 977 Jacqueline Place
- 1084 Emma Ln
- 1539 Vista Tesoro Place
- 1441 Vicki Ln
- 1147 Vaquero Way
- 1950 Lemon Ranch Rd
- 1363 Black Sage Cir
- 1357 Black Sage Cir
- 1377 Black Sage Cir
- 1374 Black Sage Cir
- 1353 Black Sage Cir
- 1379 Black Sage Cir
- 1354 Black Sage Cir
- 1378 Black Sage Cir
- 1347 Black Sage Cir
- 1383 Black Sage Cir
- 1348 Black Sage Cir
- 1343 Black Sage Cir
- 1387 Black Sage Cir
- 1344 Black Sage Cir
- 1346 Tourney Hill Ln
- 1344 Tourney Hill Ln
- 1348 Tourney Hill Ln
- 1338 Black Sage Cir
- 1360 Tourney Hill Ln