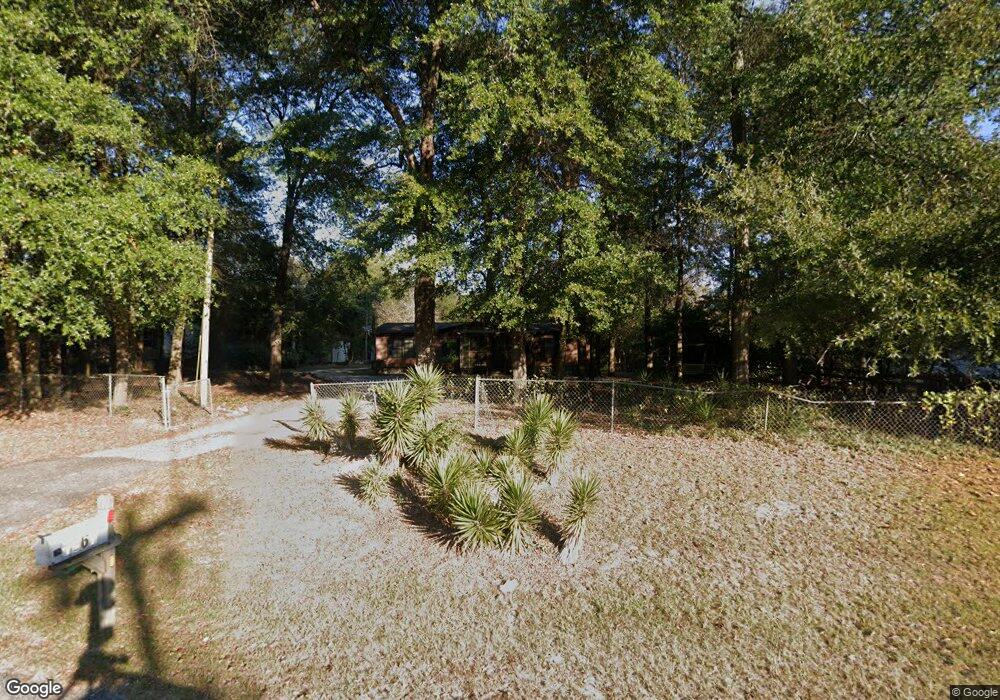
1367 Hephzibah McBean Rd Hephzibah, GA 30815
McBean NeighborhoodEstimated Value: $63,286 - $177,000
3
Beds
2
Baths
1,320
Sq Ft
$83/Sq Ft
Est. Value
About This Home
This home is located at 1367 Hephzibah McBean Rd, Hephzibah, GA 30815 and is currently estimated at $109,322, approximately $82 per square foot. 1367 Hephzibah McBean Rd is a home located in Richmond County with nearby schools including McBean Elementary School, Pine Hill Middle School, and Johnson Magnet.
Ownership History
Date
Name
Owned For
Owner Type
Purchase Details
Closed on
Oct 25, 2005
Sold by
Taylor Eddie J and Taylor Freddie W
Bought by
Deason Charles
Current Estimated Value
Home Financials for this Owner
Home Financials are based on the most recent Mortgage that was taken out on this home.
Original Mortgage
$42,750
Outstanding Balance
$298
Interest Rate
5.71%
Estimated Equity
$109,024
Purchase Details
Closed on
Jul 1, 2005
Sold by
Taylor Eddie J
Bought by
Taylor Eddie J and Taylor Freddie W
Purchase Details
Closed on
Mar 3, 2005
Sold by
Gmac Mortgage Corp
Bought by
Taylor Eddie J
Purchase Details
Closed on
Nov 17, 1997
Sold by
Fowler Winnell D
Bought by
Fowler Ronald and Fowler Winnell D
Home Financials for this Owner
Home Financials are based on the most recent Mortgage that was taken out on this home.
Original Mortgage
$37,355
Interest Rate
7.38%
Purchase Details
Closed on
Jan 1, 1987
Sold by
Rascal Enterprises
Bought by
Fowler Winnell D
Create a Home Valuation Report for This Property
The Home Valuation Report is an in-depth analysis detailing your home's value as well as a comparison with similar homes in the area
Home Values in the Area
Average Home Value in this Area
Purchase History
| Date | Buyer | Sale Price | Title Company |
|---|---|---|---|
| Deason Charles | $45,000 | -- | |
| Taylor Eddie J | -- | -- | |
| Taylor Eddie J | $23,000 | -- | |
| Fowler Ronald | -- | -- | |
| Fowler Winnell D | $8,900 | -- |
Source: Public Records
Mortgage History
| Date | Status | Borrower | Loan Amount |
|---|---|---|---|
| Open | Deason Charles | $42,750 | |
| Previous Owner | Fowler Ronald | $37,355 |
Source: Public Records
Tax History Compared to Growth
Tax History
| Year | Tax Paid | Tax Assessment Tax Assessment Total Assessment is a certain percentage of the fair market value that is determined by local assessors to be the total taxable value of land and additions on the property. | Land | Improvement |
|---|---|---|---|---|
| 2025 | $470 | $6,877 | $4,500 | $2,377 |
| 2024 | $470 | $6,877 | $4,500 | $2,377 |
| 2023 | $371 | $7,019 | $4,500 | $2,519 |
| 2022 | $363 | $6,884 | $4,500 | $2,384 |
| 2021 | $363 | $6,699 | $4,500 | $2,199 |
| 2020 | $366 | $6,834 | $4,500 | $2,334 |
| 2019 | $408 | $8,026 | $4,500 | $3,526 |
| 2016 | $423 | $8,476 | $4,500 | $3,976 |
Source: Public Records
Map
Nearby Homes
- 1530 Keron Way
- 1436 Hephzibah - McBean Rd Unit 1
- 1290 Hephzibah - McBean Rd
- 1515F Hephzibah - McBean Rd
- 2073 C Broome Rd
- 1515D Hephzibah - McBean Rd
- 1515C Hephzibah - McBean Rd
- 1515G Hephzibah - McBean Rd
- 1515H Hephzibah - McBean Rd
- 4734 Tinley Rd
- Hephzibah Unit McBean Road
- 1515B Hephzibah - McBean Rd
- 5209 Neely Rd
- 2010 McCoy Mill Rd
- 2018 Broome Rd
- 1123 Hephzibah - McBean Rd
- 1106B Hephzibah - McBean Rd
- 1027 Grindstone Creek Rd
- 1469 Clark Rd
- 4653 Hunters Mill Ct
- 1369 Hephzibah McBean Rd
- 1365 Hephzibah McBean Rd
- 1363 Hephzibah McBean Rd
- 1374 Hephzibah McBean Rd
- 1368 Hephzibah - McBean Rd
- 1373 Hephzibah McBean Rd
- 1376 Hephzibah McBean Rd
- 1378 Hephzibah McBean Rd
- 1381 Hephzibah McBean Rd
- 1368 Heph McBean Rd
- 1375 Hephzibah McBean Rd
- 1380 Hephzibah McBean Rd
- 1359 Hephzibah McBean Rd
- 1355 Hephzibah McBean Rd
- 1358 Hephzibah McBean Rd
- 1387 Hephzibah McBean Rd
- 1382 Hephzibah McBean Rd
- 1356 Hephzibah McBean Rd
- 1514 Keron Way
- 1353 Hephzibah McBean Rd