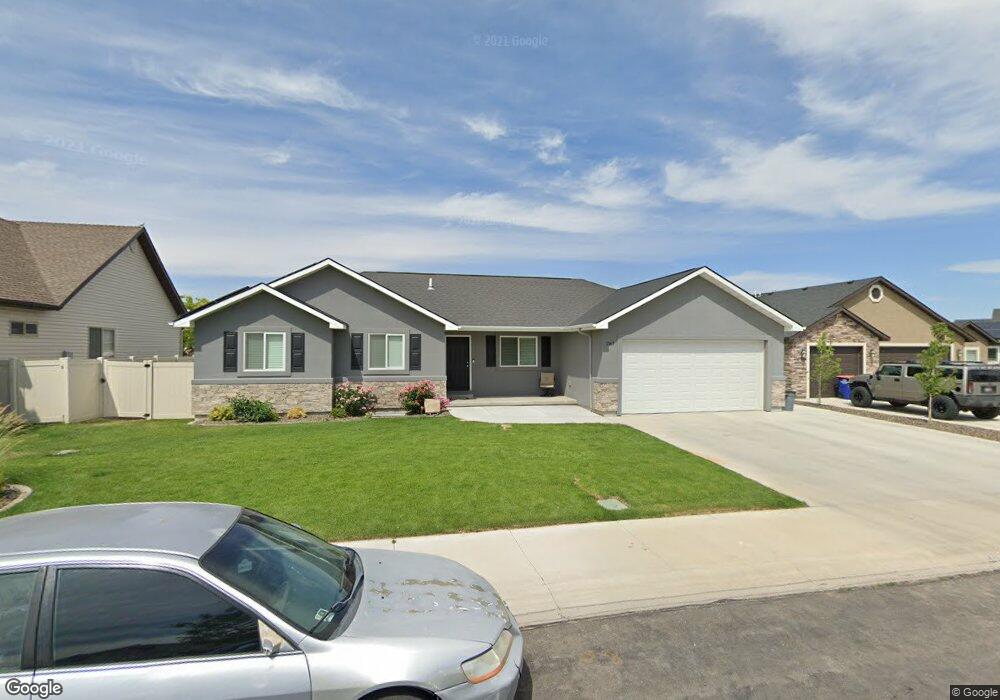
1367 Misty Meadows Ct Twin Falls, ID 83301
Estimated Value: $549,722 - $606,000
--
Bed
4
Baths
2,988
Sq Ft
$196/Sq Ft
Est. Value
About This Home
This home is located at 1367 Misty Meadows Ct, Twin Falls, ID 83301 and is currently estimated at $584,431, approximately $195 per square foot. 1367 Misty Meadows Ct is a home with nearby schools including Rock Creek Elementary School, Robert Stuart Junior High School, and Canyon Ridge High School.
Ownership History
Date
Name
Owned For
Owner Type
Purchase Details
Closed on
Oct 4, 2017
Sold by
Heider Ryan W
Bought by
Heinder Ryan and Heinder Christi
Current Estimated Value
Home Financials for this Owner
Home Financials are based on the most recent Mortgage that was taken out on this home.
Original Mortgage
$50,000
Interest Rate
3.86%
Mortgage Type
Credit Line Revolving
Purchase Details
Closed on
May 19, 2016
Sold by
Heider Christi
Bought by
Heider Ryan W
Home Financials for this Owner
Home Financials are based on the most recent Mortgage that was taken out on this home.
Original Mortgage
$216,000
Interest Rate
3.29%
Mortgage Type
Adjustable Rate Mortgage/ARM
Purchase Details
Closed on
Nov 2, 2015
Sold by
Heider Christi and Heider Christi
Bought by
Heider Ryan and Heider Christi
Home Financials for this Owner
Home Financials are based on the most recent Mortgage that was taken out on this home.
Original Mortgage
$228,000
Interest Rate
3.81%
Mortgage Type
Construction
Create a Home Valuation Report for This Property
The Home Valuation Report is an in-depth analysis detailing your home's value as well as a comparison with similar homes in the area
Home Values in the Area
Average Home Value in this Area
Purchase History
| Date | Buyer | Sale Price | Title Company |
|---|---|---|---|
| Heinder Ryan | -- | Accommodation | |
| Heider Ryan W | -- | Alliance Title Twin Falls Of | |
| Heider Ryan | -- | None Available |
Source: Public Records
Mortgage History
| Date | Status | Borrower | Loan Amount |
|---|---|---|---|
| Closed | Heinder Ryan | $50,000 | |
| Closed | Heider Ryan W | $216,000 | |
| Closed | Heider Ryan | $228,000 |
Source: Public Records
Tax History Compared to Growth
Tax History
| Year | Tax Paid | Tax Assessment Tax Assessment Total Assessment is a certain percentage of the fair market value that is determined by local assessors to be the total taxable value of land and additions on the property. | Land | Improvement |
|---|---|---|---|---|
| 2025 | $2,984 | $435,881 | $67,861 | $368,020 |
| 2024 | $2,997 | $440,161 | $67,861 | $372,300 |
| 2023 | $2,833 | $465,841 | $67,861 | $397,980 |
| 2022 | $4,025 | $475,671 | $65,376 | $410,295 |
| 2021 | $3,569 | $360,911 | $65,376 | $295,535 |
| 2020 | $3,193 | $309,309 | $59,021 | $250,288 |
| 2019 | $3,763 | $310,637 | $64,195 | $246,442 |
| 2018 | $3,235 | $272,778 | $39,422 | $233,356 |
| 2017 | $2,829 | $250,909 | $39,422 | $211,487 |
| 2016 | $790 | $39,422 | $0 | $0 |
| 2015 | $77 | $3,942 | $0 | $0 |
| 2012 | -- | $6,588 | $0 | $0 |
Source: Public Records
Map
Nearby Homes
- 1378 Misty Meadows Ct
- 1085 Easy Ave
- 1087 Easy Ave
- 831 Grace Dr W
- 1605 Grandview Dr N
- 805 Drayton Ave
- 1143 Langford Way
- 1228 Creekside Way
- 1295 Terra Ave
- 1196 Creekside Way
- 1139 Frank Henry Rd
- 1295 Starlight Loop
- 1207 Frank Henry Rd
- 1146 Creekside Way
- 1266 Crestview Dr
- 1196 Ira Burton Rd Unit Lot 20 Block 12
- 1210 Ira Burton Rd Unit Lot 21 Block 12
- 916 Kenbrook Loop
- 973 Kenbrook Loop
- 946 Kenbrook Loop
- 1379 Misty Meadows Ct
- 1349 Misty Meadows Ct
- 1051 Cottage Rd
- 1366 Misty Meadows Ct
- 1393 Misty Meadows Ct
- 1050 Easy Ave
- 1052 Cottage Rd
- 1061 Cottage Rd
- 1016 Misty Meadows Trail
- 1397 Misty Meadows Ct
- 1060 Easy Ave
- 1392 Misty Meadows Ct
- 1062 Cottage Rd
- 1071 Cottage Rd
- 1035 Misty Meadows Trail
- 1070 Easy Ave
- 1053 Retreat Ave
- 1027 Misty Meadows Trail
- 1072 Cottage Rd
- 1067 Easy Ave