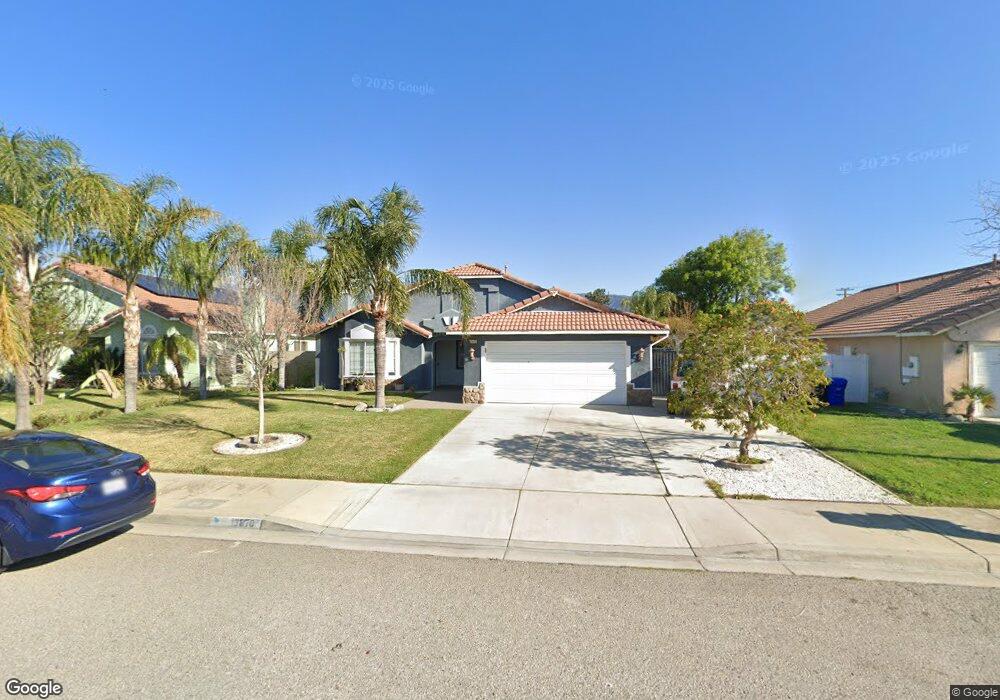
13670 Lexus Ln Fontana, CA 92335
Estimated Value: $649,000 - $686,000
4
Beds
2
Baths
1,766
Sq Ft
$375/Sq Ft
Est. Value
About This Home
This home is located at 13670 Lexus Ln, Fontana, CA 92335 and is currently estimated at $662,674, approximately $375 per square foot. 13670 Lexus Ln is a home located in San Bernardino County with nearby schools including Almond Elementary School, Sequoia Middle School, and Summit High School.
Ownership History
Date
Name
Owned For
Owner Type
Purchase Details
Closed on
Apr 10, 2020
Sold by
Orellana Sabino
Bought by
Salazar Sabino Orellana and Orellana Rosa Maura
Current Estimated Value
Purchase Details
Closed on
May 12, 2003
Sold by
Orellana Sabino
Bought by
Orellana Sabino
Home Financials for this Owner
Home Financials are based on the most recent Mortgage that was taken out on this home.
Original Mortgage
$138,718
Interest Rate
5.75%
Mortgage Type
Purchase Money Mortgage
Purchase Details
Closed on
Aug 5, 1999
Sold by
Orellana Jose E
Bought by
Orellana Sabino and Orellana Jose S
Purchase Details
Closed on
Dec 28, 1998
Sold by
Vicjer Construction Inc
Bought by
Orellana Sabino and Orellana Jose E
Home Financials for this Owner
Home Financials are based on the most recent Mortgage that was taken out on this home.
Original Mortgage
$143,328
Interest Rate
6.82%
Mortgage Type
FHA
Create a Home Valuation Report for This Property
The Home Valuation Report is an in-depth analysis detailing your home's value as well as a comparison with similar homes in the area
Home Values in the Area
Average Home Value in this Area
Purchase History
| Date | Buyer | Sale Price | Title Company |
|---|---|---|---|
| Salazar Sabino Orellana | -- | Old Republic Title | |
| Orellana Sabino | -- | Landsafe | |
| Orellana Sabino | -- | -- | |
| Orellana Sabino | $146,000 | Orange Coast Title |
Source: Public Records
Mortgage History
| Date | Status | Borrower | Loan Amount |
|---|---|---|---|
| Closed | Orellana Sabino | $138,718 | |
| Previous Owner | Orellana Sabino | $143,328 |
Source: Public Records
Tax History Compared to Growth
Tax History
| Year | Tax Paid | Tax Assessment Tax Assessment Total Assessment is a certain percentage of the fair market value that is determined by local assessors to be the total taxable value of land and additions on the property. | Land | Improvement |
|---|---|---|---|---|
| 2025 | $2,781 | $274,026 | $59,123 | $214,903 |
| 2024 | $2,781 | $268,653 | $57,964 | $210,689 |
| 2023 | $2,708 | $263,385 | $56,827 | $206,558 |
| 2022 | $2,696 | $258,221 | $55,713 | $202,508 |
| 2021 | $2,660 | $253,158 | $54,621 | $198,537 |
| 2020 | $2,653 | $250,562 | $54,061 | $196,501 |
| 2019 | $2,571 | $245,649 | $53,001 | $192,648 |
| 2018 | $2,609 | $240,833 | $51,962 | $188,871 |
| 2017 | $2,593 | $236,111 | $50,943 | $185,168 |
| 2016 | $2,548 | $231,481 | $49,944 | $181,537 |
| 2015 | $2,514 | $228,004 | $49,194 | $178,810 |
| 2014 | $2,509 | $223,537 | $48,230 | $175,307 |
Source: Public Records
Map
Nearby Homes
- 13681 Lexus Ln
- 13841 Cobblestone Ct
- 13868 Lexus Ln
- 8221 Ilex St Unit 23
- 8221 Ilex St Unit 10
- 8051 Mcgregor Ct
- 13296 Joliet Dr
- 8043 Tuscany St
- 14093 Marbella St
- 13422 Banning St
- 8283 Cornwall Ave
- 13643 Cabrillo Ct
- 14028 Yorktown Ct
- 14084 Rothchild Ct
- 8090 Cornwall Ct Unit 13
- 13414 Columbus Ct
- 7881 Margaux Place
- 14418 Bing Ave
- 14219 Point Loma St
- 14412 Bing Ave
- 13660 Lexus Ln
- 13680 Lexus Ln
- 13650 Lexus Ln
- 13683 Infiniti Ln
- 13673 Infiniti Ln
- 8296 Mulberry Ave
- 13640 Lexus Ln
- 13671 Lexus Ln
- 13663 Infiniti Ln
- 13691 Lexus Ln
- 13661 Lexus Ln
- 13653 Infiniti Ln
- 13651 Lexus Ln
- 8332 Regal Ct
- 8309 Mulberry Ave
- 8338 Regal Ct
- 8320 Regal Ct
- 8291 Acura Ct
- 8271 Acura Ct
- 13641 Lexus Ln