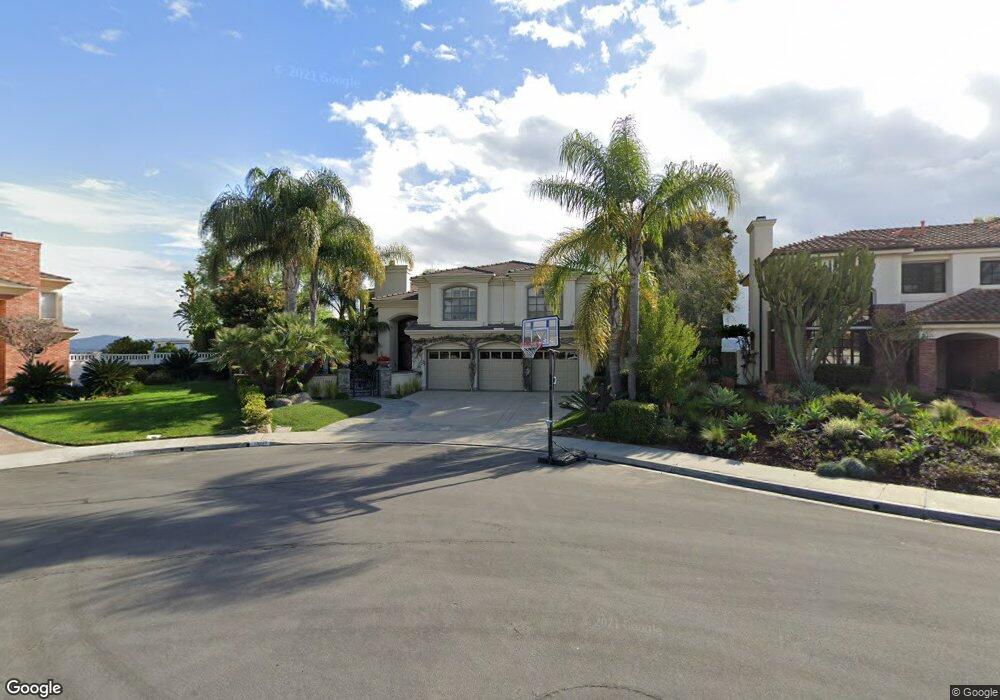
13687 Glencliff Way San Diego, CA 92130
Carmel Valley NeighborhoodEstimated Value: $3,087,000 - $3,471,000
5
Beds
5
Baths
3,620
Sq Ft
$903/Sq Ft
Est. Value
About This Home
This home is located at 13687 Glencliff Way, San Diego, CA 92130 and is currently estimated at $3,269,937, approximately $903 per square foot. 13687 Glencliff Way is a home located in San Diego County with nearby schools including Solana Highlands Elementary School, Carmel Valley Middle School, and Torrey Pines High School.
Ownership History
Date
Name
Owned For
Owner Type
Purchase Details
Closed on
Apr 8, 2013
Sold by
Miller Scott R and Miller Lisa R
Bought by
Miller Scott R and Miller Lisa R
Current Estimated Value
Home Financials for this Owner
Home Financials are based on the most recent Mortgage that was taken out on this home.
Original Mortgage
$1,054,900
Outstanding Balance
$744,616
Interest Rate
3.47%
Mortgage Type
New Conventional
Estimated Equity
$2,525,321
Purchase Details
Closed on
Feb 20, 2004
Sold by
Miller Scott R and Miller Lisa R
Bought by
Miller Scott R and Miller Lisa R
Home Financials for this Owner
Home Financials are based on the most recent Mortgage that was taken out on this home.
Original Mortgage
$995,000
Interest Rate
5.5%
Mortgage Type
New Conventional
Purchase Details
Closed on
Dec 17, 2002
Sold by
Miller Scott R and Miller Lisa R
Bought by
Miller Scott R and Miller Lisa R
Home Financials for this Owner
Home Financials are based on the most recent Mortgage that was taken out on this home.
Original Mortgage
$995,000
Interest Rate
5.87%
Purchase Details
Closed on
Oct 18, 2002
Sold by
Miller Scott R and Miller Lisa R
Bought by
Miller Scott R and Miller Lisa R
Home Financials for this Owner
Home Financials are based on the most recent Mortgage that was taken out on this home.
Original Mortgage
$995,000
Interest Rate
5.87%
Purchase Details
Closed on
Apr 16, 2001
Sold by
Koob Mark A
Bought by
Koob Patricia A
Home Financials for this Owner
Home Financials are based on the most recent Mortgage that was taken out on this home.
Original Mortgage
$1,000,000
Interest Rate
7%
Purchase Details
Closed on
Mar 23, 2001
Sold by
Koob Patricia A
Bought by
Miller Scott R and Miller Lisa R
Home Financials for this Owner
Home Financials are based on the most recent Mortgage that was taken out on this home.
Original Mortgage
$1,000,000
Interest Rate
7%
Purchase Details
Closed on
Mar 1, 2001
Sold by
Koob Mark A and Koob Patricia A
Bought by
Koob Patricia A
Home Financials for this Owner
Home Financials are based on the most recent Mortgage that was taken out on this home.
Original Mortgage
$1,000,000
Interest Rate
7%
Purchase Details
Closed on
Jun 20, 1995
Sold by
Pardee Construction Company
Bought by
Koob Mark A and Koob Patricia A
Home Financials for this Owner
Home Financials are based on the most recent Mortgage that was taken out on this home.
Original Mortgage
$610,000
Interest Rate
7.92%
Create a Home Valuation Report for This Property
The Home Valuation Report is an in-depth analysis detailing your home's value as well as a comparison with similar homes in the area
Home Values in the Area
Average Home Value in this Area
Purchase History
| Date | Buyer | Sale Price | Title Company |
|---|---|---|---|
| Miller Scott R | -- | Ticor Title Company | |
| Miller Scott R | -- | Ticor Title Company | |
| Miller Scott R | -- | -- | |
| Miller Scott R | -- | Commonwealth Land Title Co | |
| Miller Scott R | -- | Chicago Title Co | |
| Miller Scott R | -- | Chicago Title Co | |
| Miller Scott R | -- | -- | |
| Koob Patricia A | -- | First American Title | |
| Miller Scott R | $1,350,000 | First American Title | |
| Koob Patricia A | -- | First American Title | |
| Koob Mark A | -- | Chicago Title Co |
Source: Public Records
Mortgage History
| Date | Status | Borrower | Loan Amount |
|---|---|---|---|
| Open | Miller Scott R | $1,054,900 | |
| Closed | Miller Scott R | $995,000 | |
| Closed | Miller Scott R | $995,000 | |
| Closed | Miller Scott R | $1,000,000 | |
| Previous Owner | Koob Mark A | $610,000 | |
| Closed | Koob Mark A | $72,600 | |
| Closed | Miller Scott R | $100,000 |
Source: Public Records
Tax History Compared to Growth
Tax History
| Year | Tax Paid | Tax Assessment Tax Assessment Total Assessment is a certain percentage of the fair market value that is determined by local assessors to be the total taxable value of land and additions on the property. | Land | Improvement |
|---|---|---|---|---|
| 2025 | $22,598 | $2,054,328 | $1,356,158 | $698,170 |
| 2024 | $22,598 | $2,014,048 | $1,329,567 | $684,481 |
| 2023 | $22,301 | $1,974,558 | $1,303,498 | $671,060 |
| 2022 | $21,961 | $1,935,842 | $1,277,940 | $657,902 |
| 2021 | $21,597 | $1,897,885 | $1,252,883 | $645,002 |
| 2020 | $21,419 | $1,878,426 | $1,240,037 | $638,389 |
| 2019 | $21,030 | $1,841,595 | $1,215,723 | $625,872 |
| 2018 | $20,653 | $1,805,486 | $1,191,886 | $613,600 |
| 2017 | $20,323 | $1,770,085 | $1,168,516 | $601,569 |
| 2016 | $19,171 | $1,735,378 | $1,145,604 | $589,774 |
| 2015 | $18,902 | $1,709,312 | $1,128,396 | $580,916 |
| 2014 | $18,536 | $1,675,830 | $1,106,293 | $569,537 |
Source: Public Records
Map
Nearby Homes
- 4695 Rancho Verde Trail
- 4945 Rancho Verde Trail
- 13625 Winstanley Way
- 4690 Rancho Del Mar Tri
- 5146 Rancho Verde Trail
- 13323 Kibbings Rd
- 14004 Calle Venecia
- 13264 Kibbings Rd Unit 5
- 13596 Jadestone Way
- 4970 Beauchamp Ct
- 5480 Valerio Trail
- 13632 Derby Downs Ct
- 3872 Creststone Place
- 3856 Quarter Mile Dr
- 4271 Corte Favor
- 5325 Vista Del Dios
- 14231 Fox Run Row
- 5582 Valerio Trail
- 4436 Heritage Glen Ln
- 5347 Morning Sage Way
- 13679 Glencliff Way
- 13695 Glencliff Way
- 13671 Glencliff Way
- 13696 Glencliff Way
- 13686 Glencliff Way
- 13676 Glencliff Way Unit 12
- 13663 Glencliff Way
- 13666 Glencliff Way
- 13655 Glencliff Way
- 13656 Glencliff Way
- 13645 Glencliff Way
- 13646 Glencliff Way
- 13635 Glencliff Way
- 13636 Glencliff Way
- 13625 Glencliff Way
- 13626 Glencliff Way
- 13615 Glencliff Way
- 13616 Glencliff Way
- 4705 Reedley Terrace
- 4706 Reedley Terrace