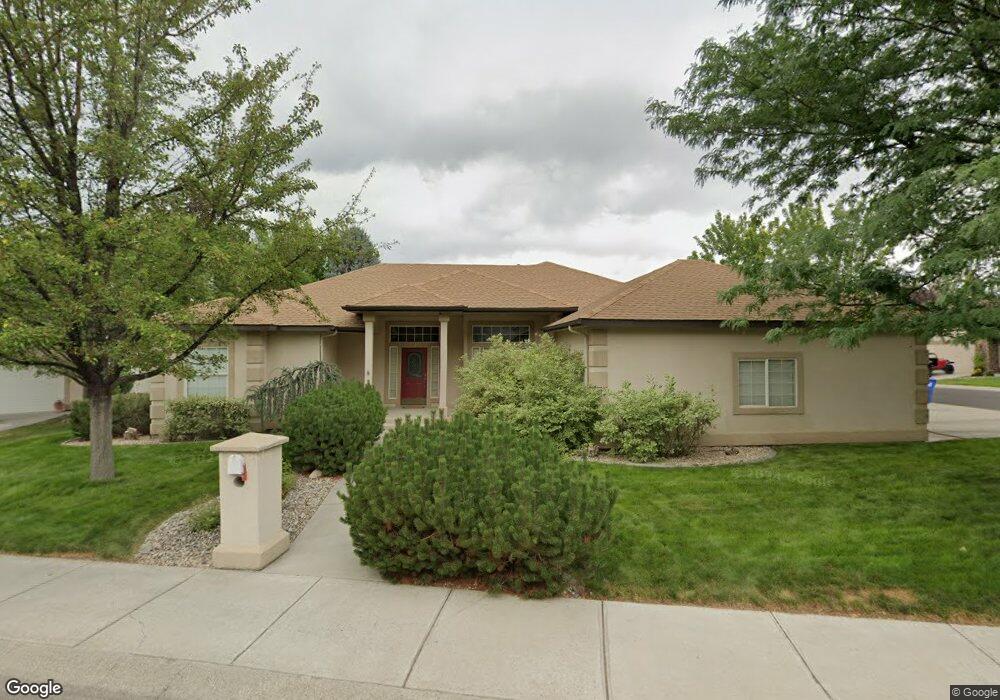
1369 Galena Dr Twin Falls, ID 83301
Estimated Value: $414,000 - $471,000
3
Beds
2
Baths
2,024
Sq Ft
$220/Sq Ft
Est. Value
About This Home
This home is located at 1369 Galena Dr, Twin Falls, ID 83301 and is currently estimated at $446,119, approximately $220 per square foot. 1369 Galena Dr is a home located in Twin Falls County with nearby schools including Sawtooth Elementary School, Vera C. O'Leary Middle School, and Twin Falls Senior High School.
Ownership History
Date
Name
Owned For
Owner Type
Purchase Details
Closed on
May 2, 2023
Sold by
Vander Pol Mike E
Bought by
Thereto Amendments
Current Estimated Value
Purchase Details
Closed on
May 22, 2019
Sold by
Pol Natalie N Delano Vander
Bought by
Vander Pol Mike E
Purchase Details
Closed on
Oct 19, 2009
Sold by
Woodside Jason and Mitchell Trisha
Bought by
Pol Natalie N Delano Vander and Pol Mike E Vander
Home Financials for this Owner
Home Financials are based on the most recent Mortgage that was taken out on this home.
Original Mortgage
$168,000
Interest Rate
5.02%
Mortgage Type
New Conventional
Purchase Details
Closed on
Sep 29, 2005
Sold by
Foutz Potthast Evelyn and Foutz Evelyn
Bought by
Woodside Jason and Mitchell Trisha
Home Financials for this Owner
Home Financials are based on the most recent Mortgage that was taken out on this home.
Original Mortgage
$205,000
Interest Rate
5.72%
Mortgage Type
New Conventional
Create a Home Valuation Report for This Property
The Home Valuation Report is an in-depth analysis detailing your home's value as well as a comparison with similar homes in the area
Home Values in the Area
Average Home Value in this Area
Purchase History
| Date | Buyer | Sale Price | Title Company |
|---|---|---|---|
| Thereto Amendments | -- | Accommodation/Courtesy Recordi | |
| Vander Pol Mike E | -- | None Available | |
| Pol Natalie N Delano Vander | -- | -- | |
| Woodside Jason | -- | -- | |
| Foutz Potthast Evelyn | -- | -- |
Source: Public Records
Mortgage History
| Date | Status | Borrower | Loan Amount |
|---|---|---|---|
| Previous Owner | Pol Natalie N Delano Vander | $168,000 | |
| Previous Owner | Woodside Jason | $205,000 |
Source: Public Records
Tax History Compared to Growth
Tax History
| Year | Tax Paid | Tax Assessment Tax Assessment Total Assessment is a certain percentage of the fair market value that is determined by local assessors to be the total taxable value of land and additions on the property. | Land | Improvement |
|---|---|---|---|---|
| 2024 | $2,611 | $401,450 | $87,339 | $314,111 |
| 2023 | $2,629 | $443,095 | $87,339 | $355,756 |
| 2022 | $3,311 | $414,119 | $64,269 | $349,850 |
| 2021 | $4,861 | $322,839 | $64,269 | $258,570 |
| 2020 | $4,102 | $268,879 | $59,099 | $209,780 |
| 2019 | $3,028 | $269,519 | $59,099 | $210,420 |
| 2018 | $2,982 | $259,240 | $39,610 | $219,630 |
| 2017 | $2,562 | $236,660 | $39,610 | $197,050 |
| 2016 | $2,115 | $200,270 | $0 | $0 |
| 2015 | $2,201 | $202,460 | $0 | $0 |
| 2012 | -- | $185,849 | $0 | $0 |
Source: Public Records
Map
Nearby Homes
- 1379 Stoneybrook Cir
- 1283 Galena Dr
- 1840 Candleridge Dr
- 1442 Stonecrest Ct
- 1239 Brundage Cir
- 1511 Evergreen Dr
- 1446 Riverbend Place
- 1440 Riverbend Place
- 1434 Riverbend Place
- 1410 Pillar St
- 1158 Locust St N
- 1925 Tamarack Loop
- 1827 Targhee Dr
- 1050 Pahsimeroi Dr
- 2024 Julie Ln
- 1409 Bitterroot Dr
- 1010 Locust St N
- 2148 Candlewood Ave
- 1540 Richmond Dr
- 1591 Princeton Dr
- 1360 Galena Dr
- 1355 Galena Dr
- 1374 Galena Dr
- 1336 Stoneybrook Cir
- 1381 Galena Dr
- 1349 Stoneybrook Cir
- 1326 Galena Dr
- 1380 Galena Dr
- 1348 Stoneybrook Cir
- 1357 Stoneybrook Cir
- 1341 Galena Dr
- 1391 Galena Dr
- 1384 Galena Dr
- 1321 Galena Dr
- 1360 Stoneybrook Cir
- 1368 Stoneybrook Cir
- 1369 Stoneybrook Cir
- 1371 Galena Ct
- 1333 Galena Dr
- 1259 Madrona St N