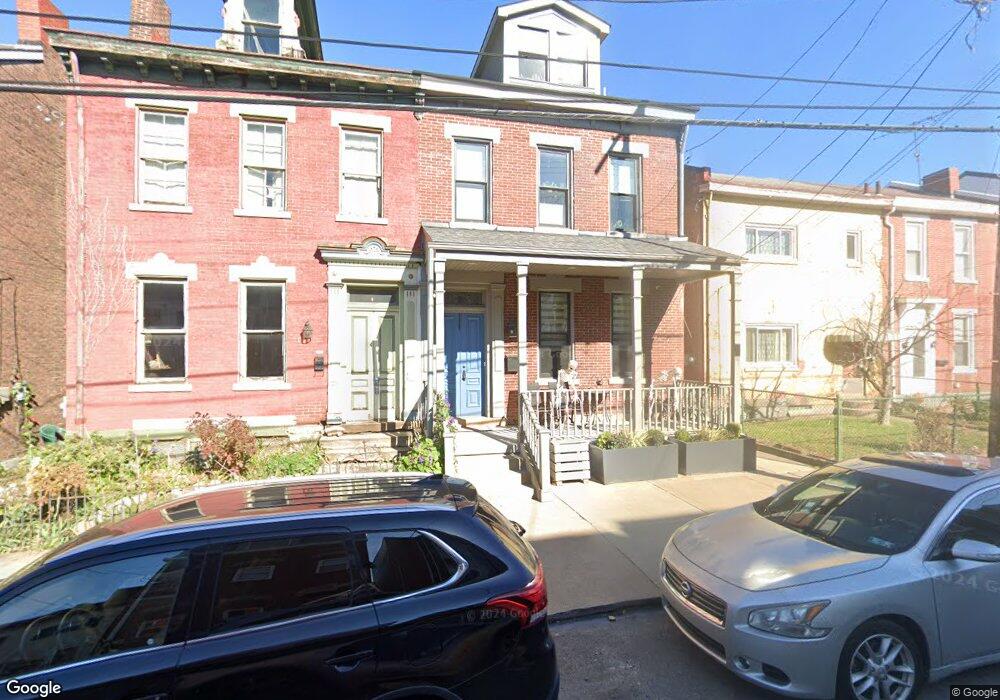
137 43rd St Pittsburgh, PA 15201
Central Lawrenceville NeighborhoodEstimated Value: $688,000 - $790,000
2
Beds
3
Baths
2,223
Sq Ft
$340/Sq Ft
Est. Value
About This Home
This home is located at 137 43rd St, Pittsburgh, PA 15201 and is currently estimated at $756,415, approximately $340 per square foot. 137 43rd St is a home located in Allegheny County with nearby schools including Pittsburgh Arsenal 6-8, Pittsburgh Arsenal K-5, and Pittsburgh Milliones 6-12.
Ownership History
Date
Name
Owned For
Owner Type
Purchase Details
Closed on
Dec 5, 2022
Sold by
Dieschbourg Barbara J and Dieschbourg Michael T
Bought by
One 137 43Rd L L C
Current Estimated Value
Purchase Details
Closed on
Nov 3, 2022
Sold by
Dieschbourg Michael T
Bought by
137 43Rd Llc
Purchase Details
Closed on
Jan 15, 2015
Sold by
Secretary Of Veterans Affairs
Bought by
Kolczynski Diana M
Purchase Details
Closed on
Nov 21, 2014
Sold by
Kolczynski Edward S
Bought by
Dieschbourg Michael T
Purchase Details
Closed on
Oct 9, 1985
Bought by
Veterans Affairs Administration
Create a Home Valuation Report for This Property
The Home Valuation Report is an in-depth analysis detailing your home's value as well as a comparison with similar homes in the area
Home Values in the Area
Average Home Value in this Area
Purchase History
| Date | Buyer | Sale Price | Title Company |
|---|---|---|---|
| One 137 43Rd L L C | $775,000 | -- | |
| 137 43Rd Llc | $775,000 | -- | |
| Kolczynski Diana M | $69,740 | -- | |
| Dieschbourg Michael T | $69,740 | -- | |
| Veterans Affairs Administration | $800 | -- |
Source: Public Records
Tax History Compared to Growth
Tax History
| Year | Tax Paid | Tax Assessment Tax Assessment Total Assessment is a certain percentage of the fair market value that is determined by local assessors to be the total taxable value of land and additions on the property. | Land | Improvement |
|---|---|---|---|---|
| 2025 | $11,338 | $417,000 | $20,100 | $396,900 |
| 2024 | $11,338 | $492,100 | $20,100 | $472,000 |
| 2023 | $1,461 | $63,400 | $20,100 | $43,300 |
| 2022 | $1,032 | $45,400 | $20,100 | $25,300 |
| 2021 | $947 | $45,400 | $20,100 | $25,300 |
| 2020 | $1,027 | $45,400 | $20,100 | $25,300 |
| 2019 | $1,027 | $45,400 | $20,100 | $25,300 |
| 2018 | $732 | $45,400 | $20,100 | $25,300 |
| 2017 | $1,027 | $45,400 | $20,100 | $25,300 |
| 2016 | $40 | $8,500 | $8,500 | $0 |
| 2015 | $40 | $26,500 | $20,100 | $6,400 |
| 2014 | $1,403 | $63,400 | $20,100 | $43,300 |
Source: Public Records
Map
Nearby Homes