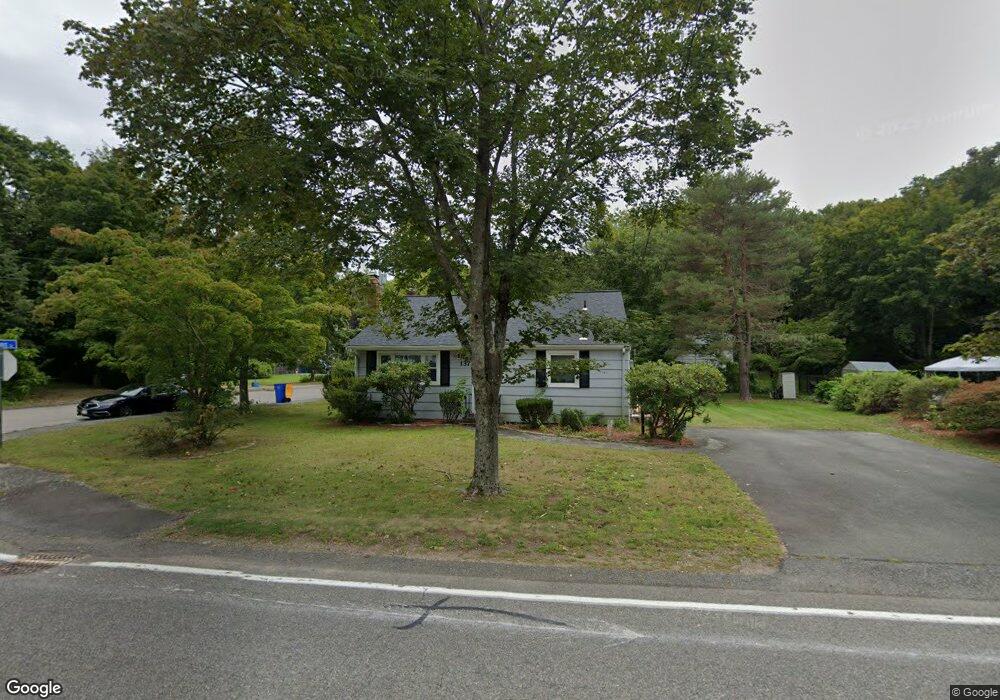
137 Allen St Randolph, MA 02368
Downtown Randolph NeighborhoodEstimated Value: $527,000 - $553,000
3
Beds
1
Bath
982
Sq Ft
$549/Sq Ft
Est. Value
About This Home
This home is located at 137 Allen St, Randolph, MA 02368 and is currently estimated at $538,945, approximately $548 per square foot. 137 Allen St is a home located in Norfolk County with nearby schools including Randolph High School, Boston Higashi School, and Lighthouse Baptist Christian Academy.
Ownership History
Date
Name
Owned For
Owner Type
Purchase Details
Closed on
Jun 26, 1998
Sold by
Klein Jonathan J
Bought by
Jenkins Deborah A
Current Estimated Value
Home Financials for this Owner
Home Financials are based on the most recent Mortgage that was taken out on this home.
Original Mortgage
$122,550
Outstanding Balance
$25,275
Interest Rate
7.09%
Mortgage Type
Purchase Money Mortgage
Estimated Equity
$513,670
Create a Home Valuation Report for This Property
The Home Valuation Report is an in-depth analysis detailing your home's value as well as a comparison with similar homes in the area
Home Values in the Area
Average Home Value in this Area
Purchase History
| Date | Buyer | Sale Price | Title Company |
|---|---|---|---|
| Jenkins Deborah A | $129,000 | -- |
Source: Public Records
Mortgage History
| Date | Status | Borrower | Loan Amount |
|---|---|---|---|
| Open | Jenkins Deborah A | $122,550 |
Source: Public Records
Tax History Compared to Growth
Tax History
| Year | Tax Paid | Tax Assessment Tax Assessment Total Assessment is a certain percentage of the fair market value that is determined by local assessors to be the total taxable value of land and additions on the property. | Land | Improvement |
|---|---|---|---|---|
| 2025 | $5,342 | $460,100 | $231,000 | $229,100 |
| 2024 | $5,218 | $455,700 | $226,600 | $229,100 |
| 2023 | $4,885 | $404,400 | $205,900 | $198,500 |
| 2022 | $4,634 | $340,700 | $171,600 | $169,100 |
| 2021 | $4,580 | $309,900 | $143,000 | $166,900 |
| 2020 | $4,470 | $299,800 | $143,000 | $156,800 |
| 2019 | $4,278 | $285,600 | $136,200 | $149,400 |
| 2018 | $4,005 | $252,200 | $123,900 | $128,300 |
| 2017 | $3,907 | $241,500 | $117,900 | $123,600 |
| 2016 | $3,833 | $220,400 | $107,100 | $113,300 |
| 2015 | $3,846 | $212,500 | $102,000 | $110,500 |
Source: Public Records
Map
Nearby Homes
- 73 Belcher St
- 44 Liberty St
- 33 Liberty St
- 20 Nelson Dr Unit 3A
- 47 West St Unit A2
- 12 Cottage St
- 12 Jasper Ln Unit 12
- 54 Jasper Ln
- 18 Jasper Ln
- 469 North St
- 17 Mill St
- 591 N Main St
- 10 Alfred Terrace
- 28 Silver St
- 1 Clark Cir
- 34 Orchard St
- 16 Simmonds Blvd Unit 16
- 20 Simmonds Blvd Unit 20
- 14 Simmonds Blvd Unit 14
- 12 Simmonds Blvd Unit 12