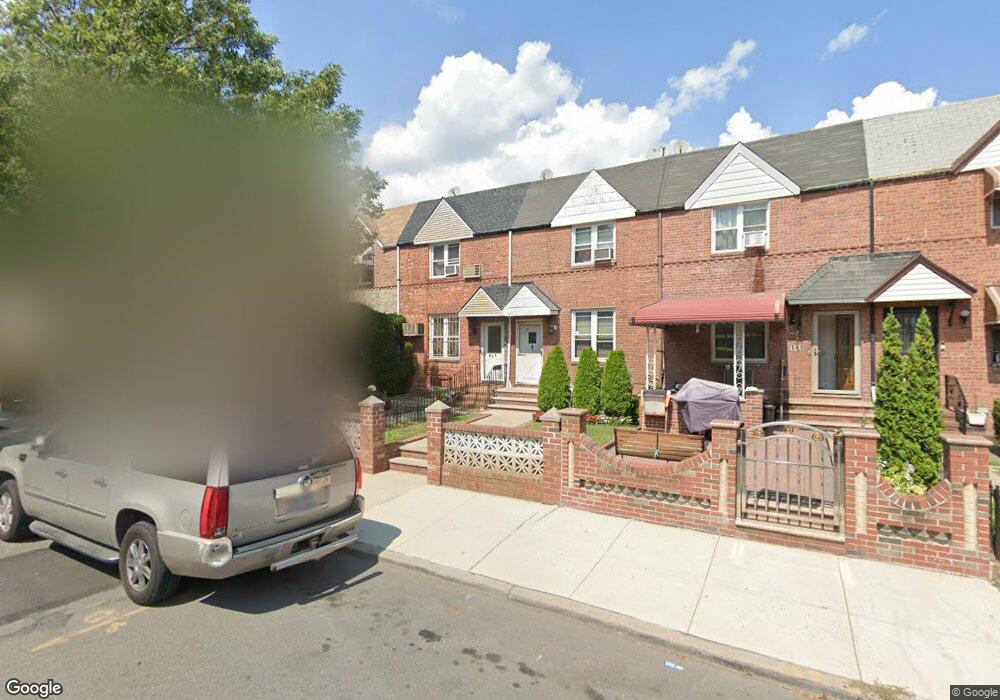
137 Branton St Brooklyn, NY 11236
East Flatbush NeighborhoodEstimated Value: $570,632 - $666,000
Studio
--
Bath
960
Sq Ft
$652/Sq Ft
Est. Value
About This Home
This home is located at 137 Branton St, Brooklyn, NY 11236 and is currently estimated at $625,658, approximately $651 per square foot. 137 Branton St is a home located in Kings County with nearby schools including P.S. 233 The Langston Hughes School, I.S. 285 Meyer Levin, and Ivy Hill Preparatory Charter School.
Ownership History
Date
Name
Owned For
Owner Type
Purchase Details
Closed on
Apr 15, 1998
Sold by
First Home Properties Corp
Bought by
Conyers Brown Mary
Current Estimated Value
Home Financials for this Owner
Home Financials are based on the most recent Mortgage that was taken out on this home.
Original Mortgage
$66,283
Interest Rate
7.11%
Mortgage Type
FHA
Purchase Details
Closed on
Aug 20, 1997
Sold by
Citibank Na
Bought by
First Home Properties Corp
Create a Home Valuation Report for This Property
The Home Valuation Report is an in-depth analysis detailing your home's value as well as a comparison with similar homes in the area
Home Values in the Area
Average Home Value in this Area
Purchase History
| Date | Buyer | Sale Price | Title Company |
|---|---|---|---|
| Conyers Brown Mary | $71,000 | Fidelity National Title Ins | |
| First Home Properties Corp | $115,000 | -- |
Source: Public Records
Mortgage History
| Date | Status | Borrower | Loan Amount |
|---|---|---|---|
| Previous Owner | Conyers Brown Mary | $66,283 |
Source: Public Records
Tax History
| Year | Tax Paid | Tax Assessment Tax Assessment Total Assessment is a certain percentage of the fair market value that is determined by local assessors to be the total taxable value of land and additions on the property. | Land | Improvement |
|---|---|---|---|---|
| 2025 | $5,154 | $41,580 | $11,280 | $30,300 |
| 2024 | $5,154 | $37,740 | $11,280 | $26,460 |
| 2023 | $4,931 | $36,300 | $11,280 | $25,020 |
| 2022 | $4,847 | $29,700 | $11,280 | $18,420 |
| 2021 | $5,056 | $25,620 | $11,280 | $14,340 |
| 2019 | $4,473 | $25,200 | $11,280 | $13,920 |
| 2018 | $4,124 | $20,232 | $8,887 | $11,345 |
| 2017 | $4,124 | $20,232 | $10,062 | $10,170 |
| 2016 | $4,003 | $20,022 | $9,777 | $10,245 |
| 2015 | $2,177 | $18,889 | $11,089 | $7,800 |
| 2014 | $2,177 | $17,820 | $12,540 | $5,280 |
Source: Public Records
Map
Nearby Homes
- 141 Branton St
- 5910 Beverley Rd
- 361 E 59th St
- 238 E 88th St Unit 2
- 8707 Avenue B
- 378 E 58th St
- 399 E 57th St
- 135 E 87th St
- 133 E 87th St
- 142 E 88th St
- 5823 Tilden Ave
- 120 E 88th St
- 159 E 89th St Unit 1
- 8818 Avenue A
- 162 E 59th St
- 664 Remsen Ave
- 8912 Avenue A
- 524 E 56th St
- 528 E 56th St
- 9023 Avenue B
Your Personal Tour Guide
Ask me questions while you tour the home.