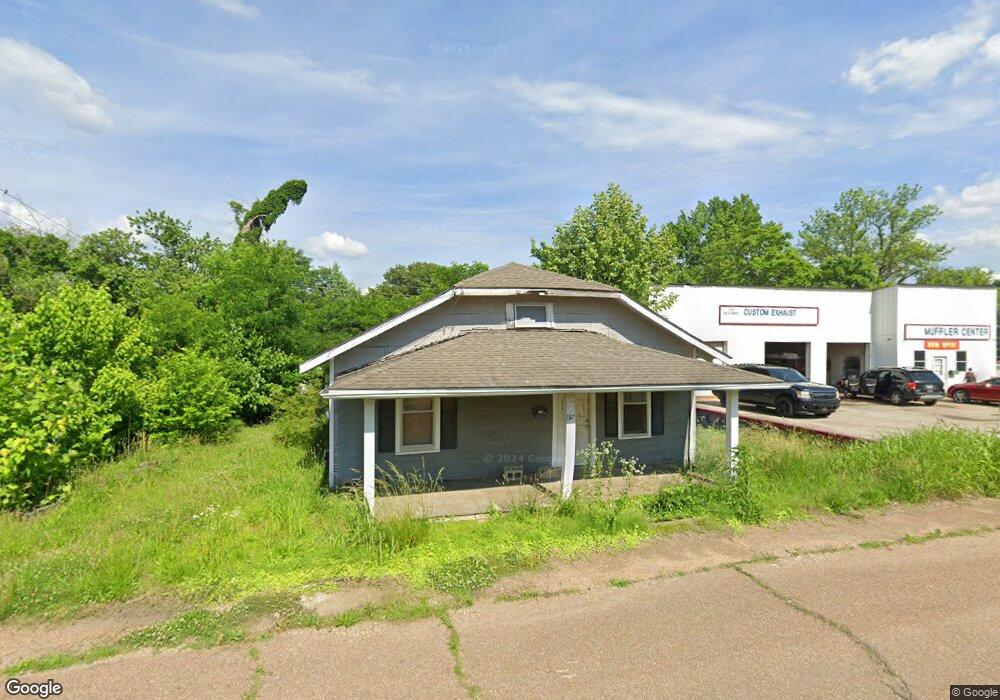
137 Broadway St South Fulton, TN 38257
Estimated Value: $47,918 - $94,000
--
Bed
1
Bath
1,156
Sq Ft
$67/Sq Ft
Est. Value
About This Home
This home is located at 137 Broadway St, South Fulton, TN 38257 and is currently estimated at $76,980, approximately $66 per square foot. 137 Broadway St is a home located in Obion County.
Ownership History
Date
Name
Owned For
Owner Type
Purchase Details
Closed on
Jul 21, 2020
Sold by
Otoole Penny
Bought by
Weatherspoon Gregory C
Current Estimated Value
Purchase Details
Closed on
Apr 9, 2019
Sold by
Swearingen Jeff
Bought by
Otoole Penny
Purchase Details
Closed on
Apr 27, 2016
Sold by
Swearingen Lana
Bought by
Swearingen Jeffrey S
Purchase Details
Closed on
Oct 14, 2014
Sold by
Blackwell Lisa Beverly
Bought by
Swearingen Jeff S and Swearingen Lana J
Purchase Details
Closed on
Apr 25, 2014
Sold by
Moss Joe
Bought by
Beverly-Blackwe Lisa
Purchase Details
Closed on
Jan 2, 2008
Sold by
Wilson Danny
Bought by
Moss Joe C
Purchase Details
Closed on
Dec 2, 2003
Bought by
Danny Wilson
Purchase Details
Closed on
Dec 22, 1999
Sold by
Neal Clinard
Bought by
Danny Wilson
Purchase Details
Closed on
Aug 25, 1958
Bought by
Clinard Neal and Clinard Helen
Purchase Details
Closed on
Jan 1, 1958
Create a Home Valuation Report for This Property
The Home Valuation Report is an in-depth analysis detailing your home's value as well as a comparison with similar homes in the area
Home Values in the Area
Average Home Value in this Area
Purchase History
| Date | Buyer | Sale Price | Title Company |
|---|---|---|---|
| Weatherspoon Gregory C | $800 | None Available | |
| Otoole Penny | -- | -- | |
| Swearingen Jeffrey S | -- | -- | |
| Swearingen Jeff S | $5,000 | -- | |
| Beverly-Blackwe Lisa | $15,000 | -- | |
| Moss Joe C | $5,000 | -- | |
| Danny Wilson | -- | -- | |
| Danny Wilson | $10,000 | -- | |
| Clinard Neal | -- | -- | |
| -- | -- | -- |
Source: Public Records
Tax History Compared to Growth
Tax History
| Year | Tax Paid | Tax Assessment Tax Assessment Total Assessment is a certain percentage of the fair market value that is determined by local assessors to be the total taxable value of land and additions on the property. | Land | Improvement |
|---|---|---|---|---|
| 2025 | -- | $3,900 | $0 | $0 |
| 2024 | -- | $3,900 | $1,200 | $2,700 |
| 2023 | $102 | $4,025 | $1,200 | $2,825 |
| 2022 | $49 | $2,600 | $1,000 | $1,600 |
| 2021 | $48 | $2,600 | $1,000 | $1,600 |
| 2020 | $93 | $2,600 | $1,000 | $1,600 |
| 2019 | $93 | $2,600 | $1,000 | $1,600 |
| 2018 | $94 | $2,600 | $1,000 | $1,600 |
| 2017 | $92 | $2,450 | $1,000 | $1,450 |
| 2016 | $92 | $2,450 | $1,000 | $1,450 |
| 2015 | $92 | $2,450 | $1,000 | $1,450 |
| 2014 | $92 | $2,450 | $1,000 | $1,450 |
Source: Public Records
Map
Nearby Homes
- 0 State Route 129
- 104 Park Ave Unit F
- 304 Eddings St
- 204 Park St
- 803 Walnut St
- 310 2nd St Unit F
- 219 4th St Unit F
- 109 West St
- 407 Oliver Dr
- 505 Park Ave Unit F
- 311 4th St Unit 311 Fourth Street
- 709 Tennessee St
- 608 Green St
- 508 Vancil St
- 507 Vancil St
- 509 Vancil St
- 411 Honey Locust Dr
- 811 Key St
- 413 Honey Locust Dr
- 1015 W 4th St