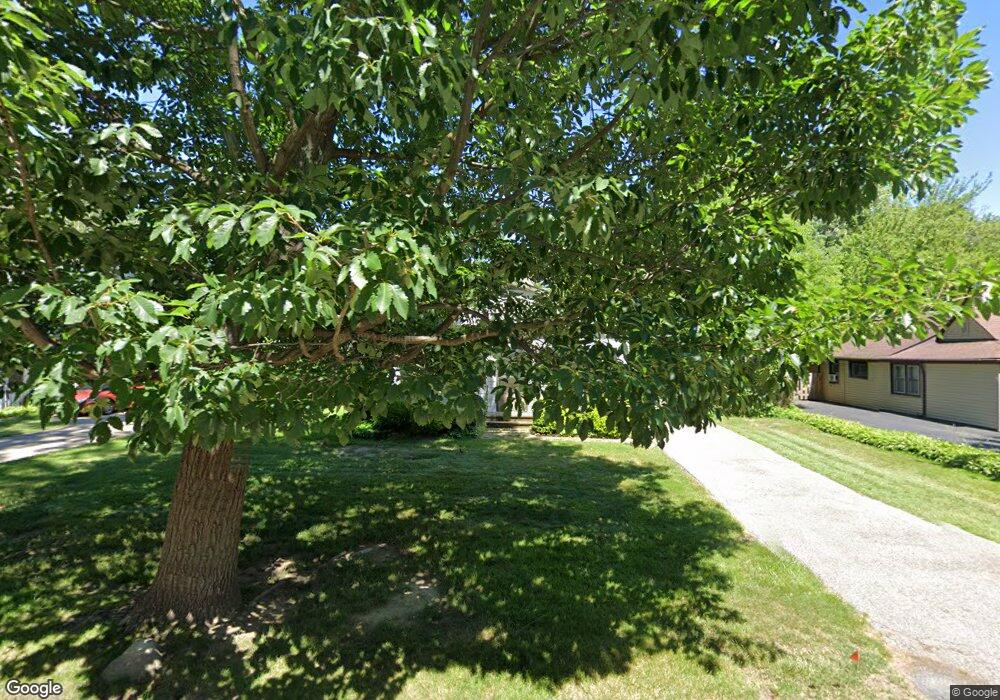
137 E 272nd St Euclid, OH 44132
Estimated Value: $126,000 - $164,000
2
Beds
1
Bath
1,216
Sq Ft
$125/Sq Ft
Est. Value
About This Home
This home is located at 137 E 272nd St, Euclid, OH 44132 and is currently estimated at $152,045, approximately $125 per square foot. 137 E 272nd St is a home located in Cuyahoga County with nearby schools including Shoreview Elementary School, Euclid High School, and Ss Robert & William Catholic School.
Ownership History
Date
Name
Owned For
Owner Type
Purchase Details
Closed on
May 24, 1996
Sold by
Trst Norman Spolar
Bought by
Carbeck David H
Current Estimated Value
Home Financials for this Owner
Home Financials are based on the most recent Mortgage that was taken out on this home.
Original Mortgage
$68,800
Outstanding Balance
$3,956
Interest Rate
8.1%
Mortgage Type
New Conventional
Estimated Equity
$148,089
Purchase Details
Closed on
Jun 17, 1993
Sold by
Bright Beatrice R
Bought by
The Beatrice R. Bright Trust
Purchase Details
Closed on
May 6, 1988
Sold by
Bright Robert K and Bright Beatrice R
Bought by
Bright Beatrice R
Purchase Details
Closed on
Oct 15, 1975
Sold by
Bright Robert K
Bought by
Bright Robert K and Bright Beatrice R
Purchase Details
Closed on
Jul 17, 1975
Sold by
Bright Elizabeth V
Bought by
Bright Robert K
Purchase Details
Closed on
Jan 1, 1975
Bought by
Bright Elizabeth
Create a Home Valuation Report for This Property
The Home Valuation Report is an in-depth analysis detailing your home's value as well as a comparison with similar homes in the area
Home Values in the Area
Average Home Value in this Area
Purchase History
| Date | Buyer | Sale Price | Title Company |
|---|---|---|---|
| Carbeck David H | $86,000 | -- | |
| The Beatrice R. Bright Trust | -- | -- | |
| Bright Beatrice R | -- | -- | |
| Bright Robert K | -- | -- | |
| Bright Robert K | -- | -- | |
| Bright Elizabeth | -- | -- |
Source: Public Records
Mortgage History
| Date | Status | Borrower | Loan Amount |
|---|---|---|---|
| Open | Carbeck David H | $68,800 |
Source: Public Records
Tax History
| Year | Tax Paid | Tax Assessment Tax Assessment Total Assessment is a certain percentage of the fair market value that is determined by local assessors to be the total taxable value of land and additions on the property. | Land | Improvement |
|---|---|---|---|---|
| 2024 | $3,796 | $55,440 | $16,170 | $39,270 |
| 2023 | $3,683 | $43,020 | $13,370 | $29,650 |
| 2022 | $3,599 | $43,020 | $13,370 | $29,650 |
| 2021 | $4,017 | $43,020 | $13,370 | $29,650 |
| 2020 | $4,075 | $39,830 | $12,390 | $27,440 |
| 2019 | $3,668 | $113,800 | $35,400 | $78,400 |
| 2018 | $3,523 | $39,830 | $12,390 | $27,440 |
| 2017 | $3,632 | $32,550 | $10,570 | $21,980 |
| 2016 | $3,641 | $32,550 | $10,570 | $21,980 |
| 2015 | $3,311 | $32,550 | $10,570 | $21,980 |
| 2014 | $3,311 | $32,550 | $10,570 | $21,980 |
Source: Public Records
Map
Nearby Homes
- 141 Eastbrook Dr
- 28507 Lakeshore Blvd
- 28525 Lakeshore Blvd
- 27175 Cameron Ave
- 427 E 275th St
- 25801 Lake Shore Blvd Unit 29
- 25801 Lake Shore Blvd Unit 25
- 25801 Lake Shore Blvd Unit 112
- 25801 Lake Shore Blvd Unit 85
- 25801 Lakeshore Blvd Unit 42
- 28642 Forest Rd
- 325 E 264th St
- 625 Lloyd Rd
- 440 E 271st St
- 29007 Uxbridge Dr
- 29008 Uxbridge Dr
- 27430 Forestview Ave
- 29310 Grand Blvd
- 375 Beechwood Dr
- 29616 Grand Blvd
Your Personal Tour Guide
Ask me questions while you tour the home.