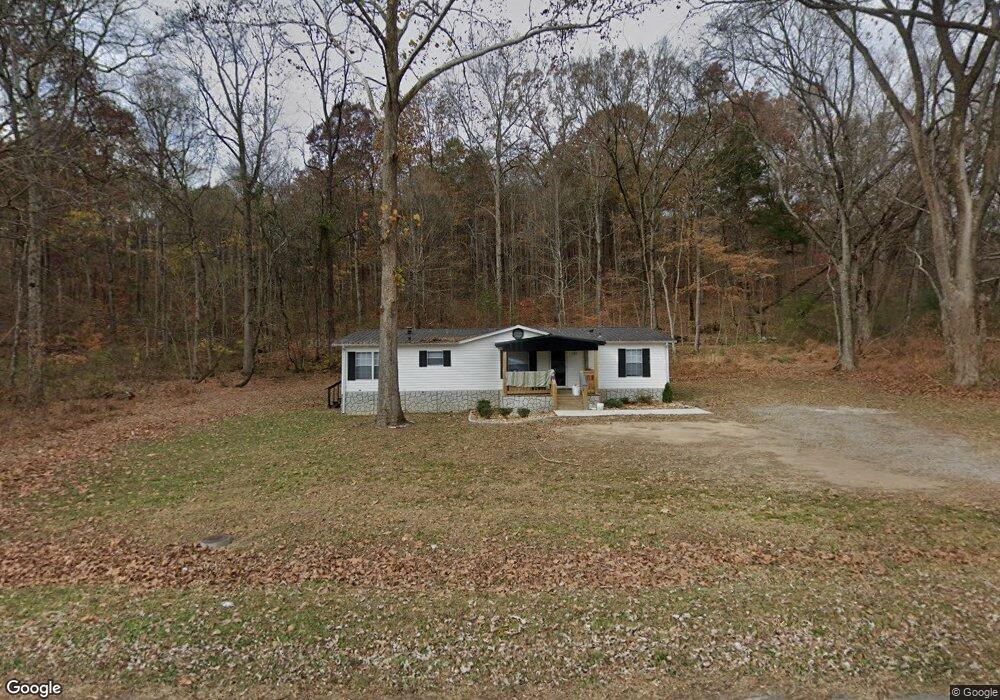
137 Elm St Dunlap, TN 37327
Estimated Value: $182,830 - $263,000
--
Bed
--
Bath
1,456
Sq Ft
$147/Sq Ft
Est. Value
About This Home
This home is located at 137 Elm St, Dunlap, TN 37327 and is currently estimated at $213,958, approximately $146 per square foot. 137 Elm St is a home located in Sequatchie County with nearby schools including Griffith Elementary School, Sequatchie County Middle School, and Sequatchie County High School.
Ownership History
Date
Name
Owned For
Owner Type
Purchase Details
Closed on
Sep 18, 2020
Sold by
Layne David J
Bought by
Johnson Gregory K and Johnson Michele S
Current Estimated Value
Purchase Details
Closed on
Oct 4, 2016
Sold by
Saxton Natalie
Bought by
Layne David J
Purchase Details
Closed on
Aug 26, 2016
Sold by
Layne David J
Bought by
Layne David J
Purchase Details
Closed on
Jul 31, 2012
Sold by
Saxton Natalie
Bought by
Saxton Natalie
Purchase Details
Closed on
Mar 14, 2012
Sold by
Sequatchie County Tennesse
Bought by
Sexton Natalie
Purchase Details
Closed on
Jul 21, 1997
Sold by
Ann Tuders Phyllis
Bought by
Saxton Charles W
Purchase Details
Closed on
Apr 25, 1997
Bought by
Tuders Phyllis Ann
Purchase Details
Closed on
Jan 1, 1982
Bought by
Lowery Morgan Rose M
Create a Home Valuation Report for This Property
The Home Valuation Report is an in-depth analysis detailing your home's value as well as a comparison with similar homes in the area
Home Values in the Area
Average Home Value in this Area
Purchase History
| Date | Buyer | Sale Price | Title Company |
|---|---|---|---|
| Johnson Gregory K | $60,000 | None Available | |
| Layne David J | -- | -- | |
| Layne David J | -- | -- | |
| Layne David J | -- | -- | |
| Layne David J | -- | -- | |
| Saxton Natalie | -- | -- | |
| Sexton Natalie | $2,000 | -- | |
| Saxton Charles W | $7,000 | -- | |
| Tuders Phyllis Ann | $6,000 | -- | |
| Lowery Morgan Rose M | $2,500 | -- |
Source: Public Records
Tax History Compared to Growth
Tax History
| Year | Tax Paid | Tax Assessment Tax Assessment Total Assessment is a certain percentage of the fair market value that is determined by local assessors to be the total taxable value of land and additions on the property. | Land | Improvement |
|---|---|---|---|---|
| 2025 | $770 | $31,900 | $0 | $0 |
| 2024 | $770 | $31,900 | $4,125 | $27,775 |
| 2023 | $770 | $31,900 | $4,125 | $27,775 |
| 2022 | $666 | $20,075 | $3,450 | $16,625 |
| 2021 | $656 | $20,075 | $3,450 | $16,625 |
| 2020 | $656 | $20,075 | $3,450 | $16,625 |
| 2019 | $656 | $20,075 | $3,450 | $16,625 |
| 2018 | $648 | $20,075 | $3,450 | $16,625 |
| 2017 | $641 | $20,075 | $3,450 | $16,625 |
| 2016 | $637 | $19,125 | $3,450 | $15,675 |
| 2015 | $608 | $18,250 | $3,450 | $14,800 |
| 2014 | $608 | $18,250 | $3,450 | $14,800 |
Source: Public Records
Map
Nearby Homes
- 696 Elm St
- 180 Hamilton St
- 35 Hummingbird Ln
- 0 Buddy Skyles Tract 1 Rd
- 252 Valley View Dr
- 0 Grandview Dr Unit 1523011
- 89 Clover Dale Rd S
- 88 Clover Dale Rd S
- 0 Jericho Lot 14 Rd
- 0 Jericho Rd Unit 1523837
- 0 Jericho Rd Unit RTC3043766
- 95 Blue Sky Rd Rd
- 254 Cdl Trail
- 13875 Rankin Ave
- 410 Cherry St
- Lot 13 B Greenfields Way
- 133 Stagg St
- 21550 U S 127
- 0 SE US Hwy 127 Unit 1519993
- 0 SE US Hwy 127 Unit 1519990
- 163 Elm St
- 431 S Timberlane Tr
- 142 Elm St
- 179 Elm St
- 59 Timber Ln
- 55 Timber Ln
- 431 Timber Ln
- 424 Timber Ln
- 423 Timber Ln
- 18 Timber Ln
- 0 Timber Ln
- 0 Timber Ln Unit 1023602
- 0 Timber Ln Unit 998203
- 0 Timber Ln Unit 1217046
- 0 Timber Ln Unit 1082539
- 0 Timber Ln Unit 1100015
- 37 Elm St
- 198 Elm St
- 82 Timber Ln
- Lot 1 Timber Ln