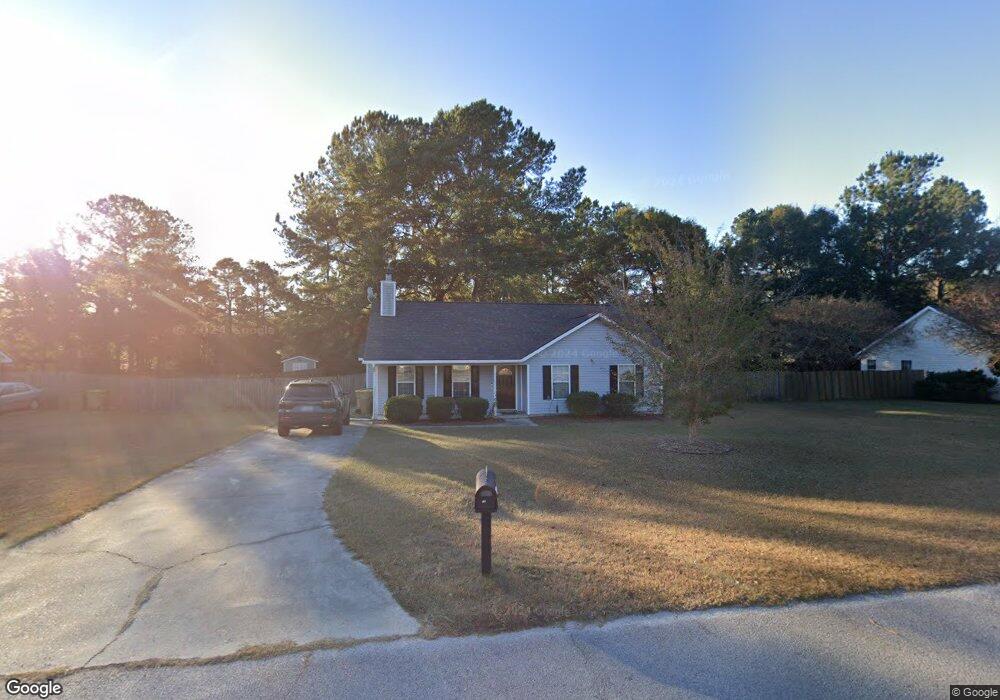
137 High Pointe Dr Rincon, GA 31326
Estimated Value: $260,000 - $282,000
3
Beds
2
Baths
1,126
Sq Ft
$238/Sq Ft
Est. Value
About This Home
This home is located at 137 High Pointe Dr, Rincon, GA 31326 and is currently estimated at $268,007, approximately $238 per square foot. 137 High Pointe Dr is a home located in Effingham County with nearby schools including Blandford Elementary School, Ebenezer Middle School, and South Effingham High School.
Ownership History
Date
Name
Owned For
Owner Type
Purchase Details
Closed on
Sep 30, 2016
Sold by
James
Bought by
Sulivan Mallory W
Current Estimated Value
Home Financials for this Owner
Home Financials are based on the most recent Mortgage that was taken out on this home.
Original Mortgage
$126,478
Outstanding Balance
$100,575
Interest Rate
3.46%
Mortgage Type
New Conventional
Estimated Equity
$167,432
Purchase Details
Closed on
Jan 23, 2009
Sold by
Fannie Mae
Bought by
Burford James and Burford Sarah
Home Financials for this Owner
Home Financials are based on the most recent Mortgage that was taken out on this home.
Original Mortgage
$94,749
Interest Rate
5.23%
Mortgage Type
FHA
Purchase Details
Closed on
Oct 7, 2008
Sold by
Citimortgage Inc
Bought by
Federal National Mortgage Association
Purchase Details
Closed on
Dec 16, 2005
Sold by
Coleman Joella H
Bought by
Coleman Joella H and Coleman Robert B
Home Financials for this Owner
Home Financials are based on the most recent Mortgage that was taken out on this home.
Original Mortgage
$122,900
Interest Rate
6.28%
Mortgage Type
New Conventional
Create a Home Valuation Report for This Property
The Home Valuation Report is an in-depth analysis detailing your home's value as well as a comparison with similar homes in the area
Home Values in the Area
Average Home Value in this Area
Purchase History
| Date | Buyer | Sale Price | Title Company |
|---|---|---|---|
| Sulivan Mallory W | $123,000 | -- | |
| Burford James | -- | -- | |
| Federal National Mortgage Association | $112,308 | -- | |
| Citimortgage Inc | $112,308 | -- | |
| Coleman Joella H | -- | -- | |
| Coleman Joella H | $122,900 | -- |
Source: Public Records
Mortgage History
| Date | Status | Borrower | Loan Amount |
|---|---|---|---|
| Open | Sulivan Mallory W | $126,478 | |
| Previous Owner | Burford James | $94,749 | |
| Previous Owner | Coleman Joella H | $122,900 |
Source: Public Records
Tax History
| Year | Tax Paid | Tax Assessment Tax Assessment Total Assessment is a certain percentage of the fair market value that is determined by local assessors to be the total taxable value of land and additions on the property. | Land | Improvement |
|---|---|---|---|---|
| 2025 | $1,943 | $92,356 | $22,800 | $69,556 |
| 2024 | $1,943 | $90,424 | $22,800 | $67,624 |
| 2023 | $1,175 | $73,608 | $18,800 | $54,808 |
| 2022 | $1,651 | $60,514 | $17,600 | $42,914 |
| 2021 | $1,602 | $51,321 | $14,000 | $37,321 |
| 2020 | $1,581 | $51,768 | $12,000 | $39,768 |
| 2019 | $1,587 | $50,206 | $12,000 | $38,206 |
| 2018 | $1,559 | $46,859 | $10,000 | $36,859 |
| 2017 | $1,527 | $45,424 | $10,000 | $35,424 |
| 2016 | $1,548 | $43,918 | $16,000 | $27,918 |
| 2015 | -- | $37,527 | $7,200 | $30,327 |
| 2014 | -- | $35,927 | $5,600 | $30,327 |
| 2013 | -- | $33,518 | $5,600 | $27,918 |
Source: Public Records
Map
Nearby Homes
- 1199 Chimney Rd
- 1165 Chimney Rd
- 216 Sage Field Dr
- 210 Grist Mill Dr
- 317 St Andrews Rd
- 411 Plantation Place
- 417 Keiffer Dr
- 235 Saint Andrews Rd
- 414 Roberts Way
- 0 Abercorn Rd
- 233 Jasper Ln
- 1633 Fort Howard Rd
- 225 Jasper Ln
- 101 Red Bluff Run
- 219 Jasper Ln
- 1879 Old Augusta Rd S
- 22 Grove Hollow Rd
- 44 Grove Hollow Rd
- 19 Grove Hollow Rd
- 28 Grove Hollow Rd
- 139 High Pointe Dr
- 135 High Pointe Dr
- 141 High Pointe Dr
- 133 High Pointe Dr
- 154 High Pointe Dr
- 156 High Pointe Dr
- 113 High Pointe Dr
- 115 High Pointe Dr
- 152 High Pointe Dr
- 158 High Pointe Dr
- 111 High Pointe Dr
- 117 High Pointe Dr
- 158 High Point Dr
- 143 High Pointe Dr
- 111 High Pointe Dr
- 150 High Pointe Dr
- 109 High Pointe Dr
- 160 High Pointe Dr
- 131 High Pointe Dr
- 119 High Pointe Dr Unit 20
Your Personal Tour Guide
Ask me questions while you tour the home.