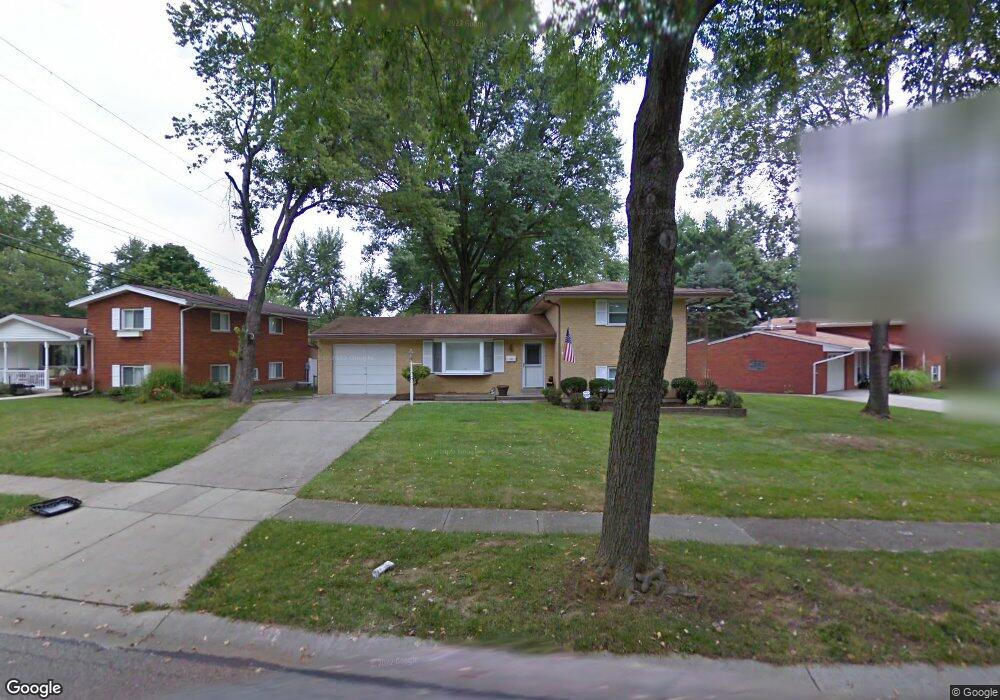
137 Julep Ln Cincinnati, OH 45218
Estimated Value: $234,000 - $261,000
4
Beds
2
Baths
1,570
Sq Ft
$158/Sq Ft
Est. Value
About This Home
This home is located at 137 Julep Ln, Cincinnati, OH 45218 and is currently estimated at $247,957, approximately $157 per square foot. 137 Julep Ln is a home located in Hamilton County with nearby schools including Calvary Academy- The.
Ownership History
Date
Name
Owned For
Owner Type
Purchase Details
Closed on
Mar 3, 2005
Sold by
Ludwig Jeffrey J and Ludwig Susan J
Bought by
Smith Richard G
Current Estimated Value
Home Financials for this Owner
Home Financials are based on the most recent Mortgage that was taken out on this home.
Original Mortgage
$122,075
Outstanding Balance
$60,228
Interest Rate
5.61%
Mortgage Type
Fannie Mae Freddie Mac
Estimated Equity
$187,729
Create a Home Valuation Report for This Property
The Home Valuation Report is an in-depth analysis detailing your home's value as well as a comparison with similar homes in the area
Home Values in the Area
Average Home Value in this Area
Purchase History
| Date | Buyer | Sale Price | Title Company |
|---|---|---|---|
| Smith Richard G | $128,500 | Vintage Title Agency Inc |
Source: Public Records
Mortgage History
| Date | Status | Borrower | Loan Amount |
|---|---|---|---|
| Open | Smith Richard G | $122,075 |
Source: Public Records
Tax History
| Year | Tax Paid | Tax Assessment Tax Assessment Total Assessment is a certain percentage of the fair market value that is determined by local assessors to be the total taxable value of land and additions on the property. | Land | Improvement |
|---|---|---|---|---|
| 2025 | $5,145 | $70,421 | $11,638 | $58,783 |
| 2023 | $4,391 | $70,421 | $11,638 | $58,783 |
| 2022 | $4,404 | $52,763 | $12,068 | $40,695 |
| 2021 | $4,314 | $52,763 | $12,068 | $40,695 |
| 2020 | $4,377 | $52,763 | $12,068 | $40,695 |
| 2019 | $4,255 | $45,098 | $10,315 | $34,783 |
| 2018 | $4,264 | $45,098 | $10,315 | $34,783 |
| 2017 | $3,953 | $45,098 | $10,315 | $34,783 |
| 2016 | $3,733 | $41,574 | $11,092 | $30,482 |
| 2015 | $3,507 | $41,574 | $11,092 | $30,482 |
| 2014 | $3,589 | $41,574 | $11,092 | $30,482 |
| 2013 | $3,789 | $45,189 | $12,058 | $33,131 |
Source: Public Records
Map
Nearby Homes
- 16 Japonica Dr
- 38 Handel Ln
- 34 Gambier Cir
- 37 Hayden Dr
- 749 Converse Dr
- 11 Dewitt Ct
- 778 Danbury Rd
- 9 Dewitt Ct
- 7 Dewitt Ct
- 6 Chalmers Ct
- 683 Danbury Rd
- 920 Waycross Rd
- 11 Ashby St
- 1013 Ligorio Ave
- 602 Brightview Place
- 602 Brightview Place Unit 34
- 1314 Waycross Rd
- 564 Waycross Rd
- 6 Belknap Place 1
- 11315 Lincolnshire Dr
Your Personal Tour Guide
Ask me questions while you tour the home.