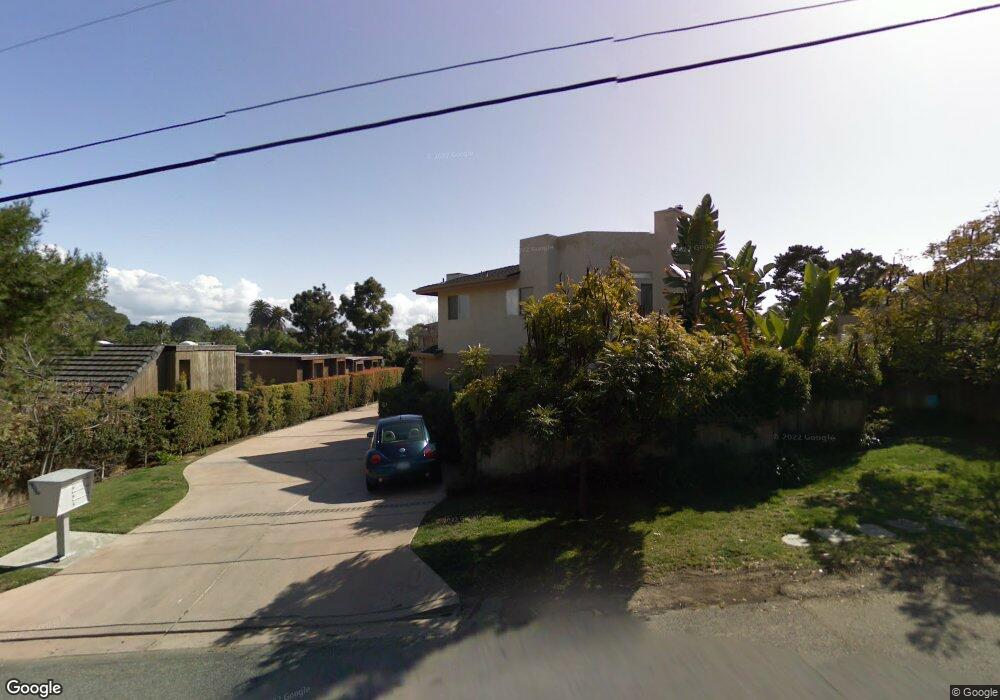
137 Jupiter St Unit 1 Encinitas, CA 92024
Leucadia NeighborhoodEstimated Value: $1,687,000 - $2,130,000
2
Beds
3
Baths
2,165
Sq Ft
$843/Sq Ft
Est. Value
About This Home
This home is located at 137 Jupiter St Unit 1, Encinitas, CA 92024 and is currently estimated at $1,825,821, approximately $843 per square foot. 137 Jupiter St Unit 1 is a home located in San Diego County with nearby schools including Paul Ecke-Central Elementary, Diegueno Middle School, and La Costa Canyon High School.
Ownership History
Date
Name
Owned For
Owner Type
Purchase Details
Closed on
Dec 23, 2025
Sold by
Higgins Leah E and Higgins Family Trust
Bought by
Higgins Family Trust and Higgins
Current Estimated Value
Home Financials for this Owner
Home Financials are based on the most recent Mortgage that was taken out on this home.
Original Mortgage
$800,500
Outstanding Balance
$799,732
Interest Rate
6.19%
Mortgage Type
New Conventional
Estimated Equity
$1,026,089
Purchase Details
Closed on
Jul 9, 2024
Sold by
Higgins Patrick and Higgins Leah
Bought by
Higgins Family Trust and Higgins
Purchase Details
Closed on
Nov 3, 2023
Sold by
Higgins Family Trust and Higgins Leah
Bought by
Higgins Patrick and Higgins Leah
Purchase Details
Closed on
Jan 15, 2002
Sold by
Jupiter 4 Llc
Bought by
Higgins Patrick and Higgins Leah
Home Financials for this Owner
Home Financials are based on the most recent Mortgage that was taken out on this home.
Original Mortgage
$480,000
Interest Rate
5.61%
Mortgage Type
Purchase Money Mortgage
Create a Home Valuation Report for This Property
The Home Valuation Report is an in-depth analysis detailing your home's value as well as a comparison with similar homes in the area
Home Values in the Area
Average Home Value in this Area
Purchase History
| Date | Buyer | Sale Price | Title Company |
|---|---|---|---|
| Higgins Family Trust | -- | None Listed On Document | |
| Higgins Family Trust | -- | None Listed On Document | |
| Higgins Patrick | -- | First American Title | |
| Higgins Patrick | $585,000 | Chicago Title Co | |
| Illingworth Godfrey | $600,000 | Chicago Title Co |
Source: Public Records
Mortgage History
| Date | Status | Borrower | Loan Amount |
|---|---|---|---|
| Open | Higgins Family Trust | $800,500 | |
| Previous Owner | Illingworth Godfrey | $480,000 | |
| Previous Owner | Higgins Patrick | $250,000 |
Source: Public Records
Tax History
| Year | Tax Paid | Tax Assessment Tax Assessment Total Assessment is a certain percentage of the fair market value that is determined by local assessors to be the total taxable value of land and additions on the property. | Land | Improvement |
|---|---|---|---|---|
| 2025 | $8,796 | $790,339 | $443,181 | $347,158 |
| 2024 | $8,796 | $774,843 | $434,492 | $340,351 |
| 2023 | $8,548 | $759,651 | $425,973 | $333,678 |
| 2022 | $8,346 | $744,757 | $417,621 | $327,136 |
| 2021 | $8,208 | $730,155 | $409,433 | $320,722 |
| 2020 | $8,076 | $722,669 | $405,235 | $317,434 |
| 2019 | $7,916 | $708,500 | $397,290 | $311,210 |
| 2018 | $7,765 | $694,608 | $389,500 | $305,108 |
| 2017 | $191 | $680,989 | $381,863 | $299,126 |
| 2016 | $7,395 | $667,637 | $374,376 | $293,261 |
| 2015 | $7,265 | $657,609 | $368,753 | $288,856 |
| 2014 | $7,102 | $644,728 | $361,530 | $283,198 |
Source: Public Records
Map
Nearby Homes
- 162 Jupiter St
- 1524 N Coast Highway 101
- 1549 N Vulcan Ave Unit 3
- 1549 N Vulcan Ave Unit 36
- 170 Diana St
- 1624 N Coast Highway 101 Unit 2
- 1624 N Coast Highway 101 Unit 45
- 1624 N Coast Highway 101 Unit 6
- 1624 N Coast Hwy 101 Unit 3
- 265 Sanford St
- 149 W Glaucus St Unit D
- 273 Hillcrest Dr
- 159 Diana St Unit 6
- 159 Diana St Unit 4
- 251 E Glaucus St
- 1715 Kennington Rd
- 1680 N Coast Highway 101 Unit 30
- 123 Jasper St
- 123 Jasper St Unit spc 35
- 123 Jasper St Unit 16
- 137 Jupiter St
- 139 Jupiter St Unit 3
- 143 Jupiter St
- 141 Jupiter St
- 129 Jupiter St Unit E
- 129 Jupiter St Unit B
- 129 Jupiter St
- 149 Jupiter St Unit 51
- 147 Jupiter St Unit 2
- 145 Jupiter St
- 149 Jupiter St
- 123 Jupiter St
- 157 Jupiter St
- 144 W Jason St
- 146 W Jason St Unit L3
- 163 Jupiter St
- 1405 Coop St
- 151 Jupiter St
- 152 Jupiter St
- 140 W Jason St
Your Personal Tour Guide
Ask me questions while you tour the home.