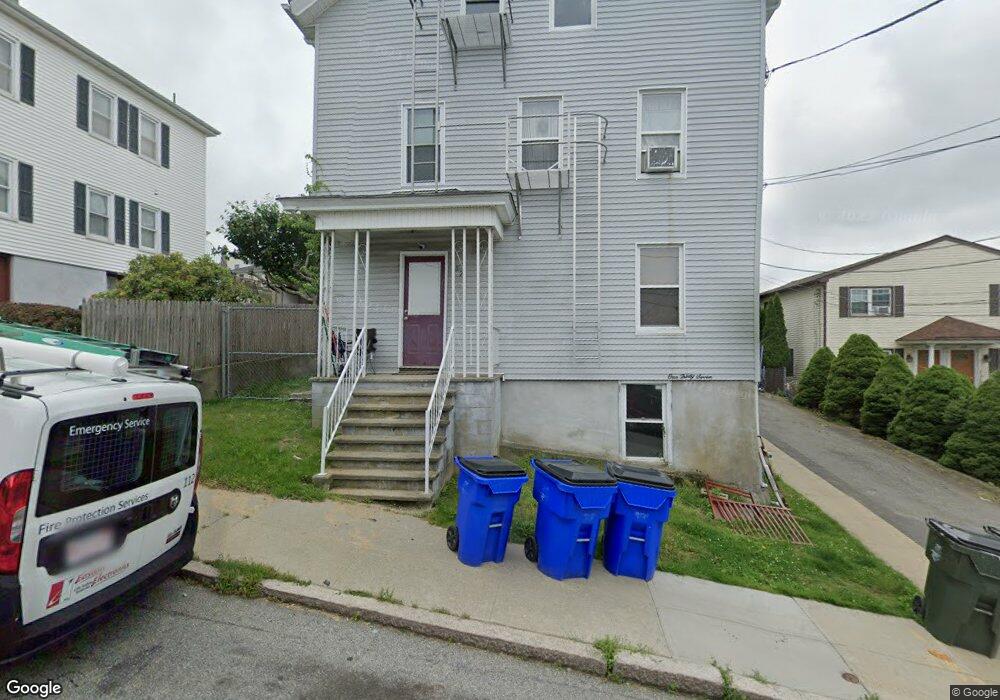
137 Langley St Fall River, MA 02720
Western Fall River NeighborhoodEstimated Value: $366,444 - $659,000
8
Beds
3
Baths
2,914
Sq Ft
$169/Sq Ft
Est. Value
About This Home
This home is located at 137 Langley St, Fall River, MA 02720 and is currently estimated at $491,611, approximately $168 per square foot. 137 Langley St is a home located in Bristol County with nearby schools including James Tansey Elementary School, Morton Middle School, and B M C Durfee High School.
Ownership History
Date
Name
Owned For
Owner Type
Purchase Details
Closed on
Nov 27, 2009
Sold by
Cloutier Richard K and Cloutier Patricia
Bought by
Rpc Prop Llc
Current Estimated Value
Purchase Details
Closed on
Mar 31, 2009
Sold by
Hsbc Mortgage Svcs Inc and Williams
Bought by
Cloutier Richard K and Cloutier Patricia
Home Financials for this Owner
Home Financials are based on the most recent Mortgage that was taken out on this home.
Original Mortgage
$165,000
Interest Rate
5.14%
Mortgage Type
Purchase Money Mortgage
Purchase Details
Closed on
Jan 7, 2000
Sold by
Bigos Craig P
Bought by
Indymac Inc
Purchase Details
Closed on
May 19, 1998
Sold by
Bigos Craig P
Bought by
Bigos Craig P
Purchase Details
Closed on
Aug 12, 1992
Sold by
Condo Management
Bought by
Bigas Craig P and Garcia Aurelia J
Purchase Details
Closed on
Jul 22, 1991
Sold by
Lucas William G
Bought by
Cndmnm Mgmt Of Fr Inc
Create a Home Valuation Report for This Property
The Home Valuation Report is an in-depth analysis detailing your home's value as well as a comparison with similar homes in the area
Home Values in the Area
Average Home Value in this Area
Purchase History
| Date | Buyer | Sale Price | Title Company |
|---|---|---|---|
| Rpc Prop Llc | -- | -- | |
| Rpc Prop Llc | -- | -- | |
| Cloutier Richard K | $167,000 | -- | |
| Cloutier Richard K | $167,000 | -- | |
| Cloutier Richard K | $167,000 | -- | |
| Indymac Inc | $106,238 | -- | |
| Indymac Inc | $106,238 | -- | |
| Bigos Craig P | $140,000 | -- | |
| Bigas Craig P | $87,000 | -- | |
| Bigas Craig P | $87,000 | -- | |
| Cndmnm Mgmt Of Fr Inc | $125,000 | -- | |
| Cndmnm Mgmt Of Fr Inc | $125,000 | -- |
Source: Public Records
Mortgage History
| Date | Status | Borrower | Loan Amount |
|---|---|---|---|
| Previous Owner | Cloutier Richard K | $165,000 |
Source: Public Records
Tax History
| Year | Tax Paid | Tax Assessment Tax Assessment Total Assessment is a certain percentage of the fair market value that is determined by local assessors to be the total taxable value of land and additions on the property. | Land | Improvement |
|---|---|---|---|---|
| 2025 | $3,934 | $343,600 | $113,400 | $230,200 |
| 2024 | $3,795 | $330,300 | $111,200 | $219,100 |
| 2023 | $3,428 | $279,400 | $100,100 | $179,300 |
| 2022 | $3,087 | $244,600 | $94,500 | $150,100 |
| 2021 | $2,896 | $209,400 | $90,300 | $119,100 |
| 2020 | $2,644 | $183,000 | $86,100 | $96,900 |
| 2019 | $2,432 | $166,800 | $90,000 | $76,800 |
| 2018 | $2,330 | $159,400 | $90,700 | $68,700 |
| 2017 | $2,232 | $159,400 | $90,700 | $68,700 |
| 2016 | $2,188 | $160,500 | $93,500 | $67,000 |
| 2015 | $2,184 | $167,000 | $93,500 | $73,500 |
| 2014 | $2,190 | $174,100 | $93,500 | $80,600 |
Source: Public Records
Map
Nearby Homes
- 17 Langley St
- 108 Stowe St Unit 108
- 164 Narragansett St
- 208 Florence St
- 333 Langley St
- 160 Stewart St
- 131 Stewart St Unit 2
- 131 Stewart St Unit 3A
- 195 Crescent St Unit 3
- 102 Vestal St
- 213 Weetamoe St
- 29 Valentine St
- 376 N Underwood St
- 247 Albany St
- 36 Saint Mary St
- 82 Wellington St
- 1231 Robeson St
- 302 Cory St
- 27 Kane St
- 274 Archer St
- 137 Langley St Unit 2
- 115 Langley St Unit 117
- 139 Langley St
- 139 Langley St Unit 1
- 139 Langley St Unit 3
- 147 Langley St
- 117 Langley St
- 136 Langley St
- 109 Langley St
- 109 Langley St Unit 10
- 109 Langley St Unit 9
- 109 Langley St Unit 8
- 109 Langley St Unit 7
- 109 Langley St Unit 6
- 109 Langley St Unit 5
- 109 Langley St Unit 4
- 109 Langley St Unit 3
- 109 Langley St Unit 2
- 109 Langley St Unit 1A
- 109 Langley St Unit 1
Your Personal Tour Guide
Ask me questions while you tour the home.